
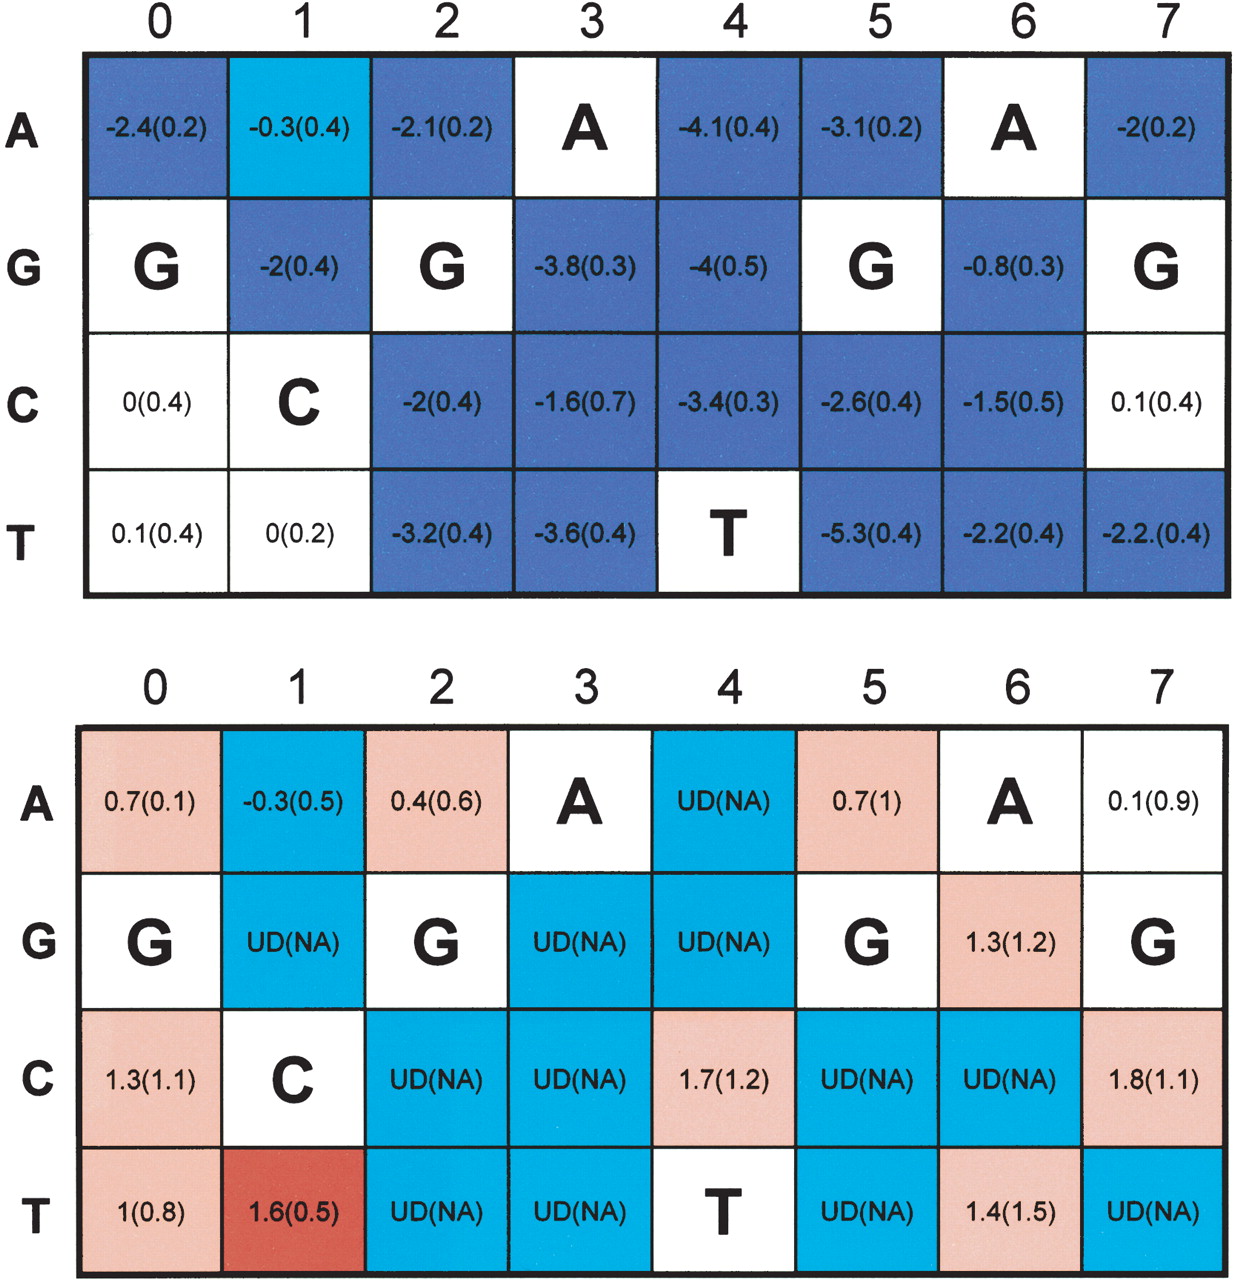
Selection on the ESR1 consensus. The color-coded matrices specify substitution rates from the motif to its neighbors (upper MSSM) and vice versa (lower MSSM). Rows in the matrices represent nucleotides; columns stand for positions in the octamer. The number inside the cell indicates the substitution rate when the neighbor has the nucleotide associated with the row in the position associated with the column, and all other motif nucleotides are unchanged. Blue and cyan cells indicate low rates (ρ < 0 at 2 SD and 0.5 SD, resp.); red and pink cells indicate high rates (ρ > 0 at 2 SD and 0.5 SD, resp.). For example, the substitution of T with C at position 4 (GCGATGAG →GCGACGAG, upper matrix, cell C4) has the rate -3.4. The SDs of the rate estimations are given in parentheses. Most substitutions that perturb the ESR1 consensus have a very low rate, with few exceptions that appear not to disrupt functionality. On the other hand, several substitutions that lead to the consensus appear with high rates, suggesting the possibility of motif optimization toward the preferable binding site.


