
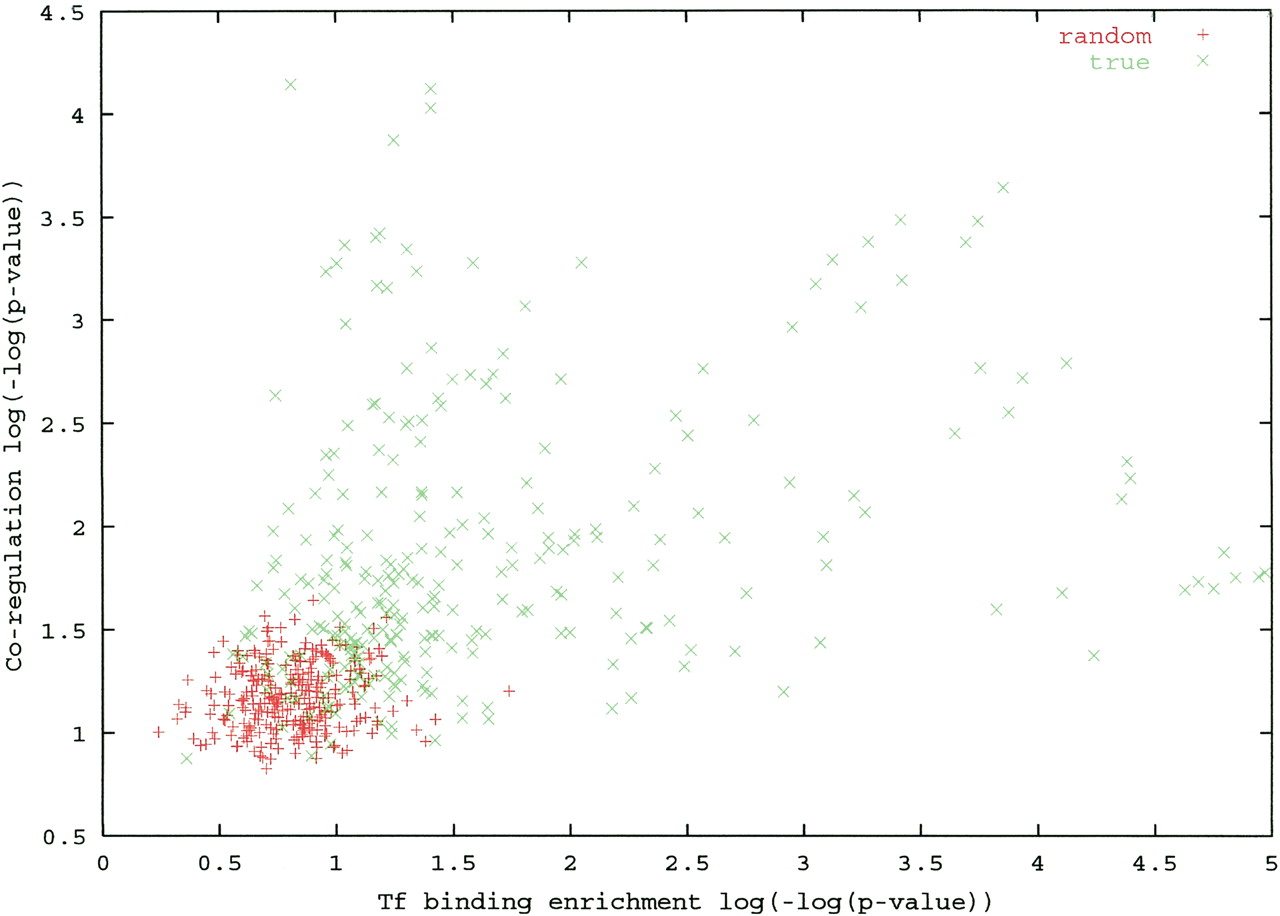
Figure 2
Functional enrichment of genes associated with motif families. Each point represents a motif family. For each family, the set of genes that contain a motif from the family in their promoter was identified. The P-value of the best match to a ChIP experimental profile (x-coordinate) and the highest coregulation achieved in a collection of gene expression experiments (y-coordinate) were computed. The vast majority of true motif clusters (green) are strongly supported by functional data, and are well separated from the respective P-values computed with the same motif clusters but randomly shuffled promoter-gene association (red).


