
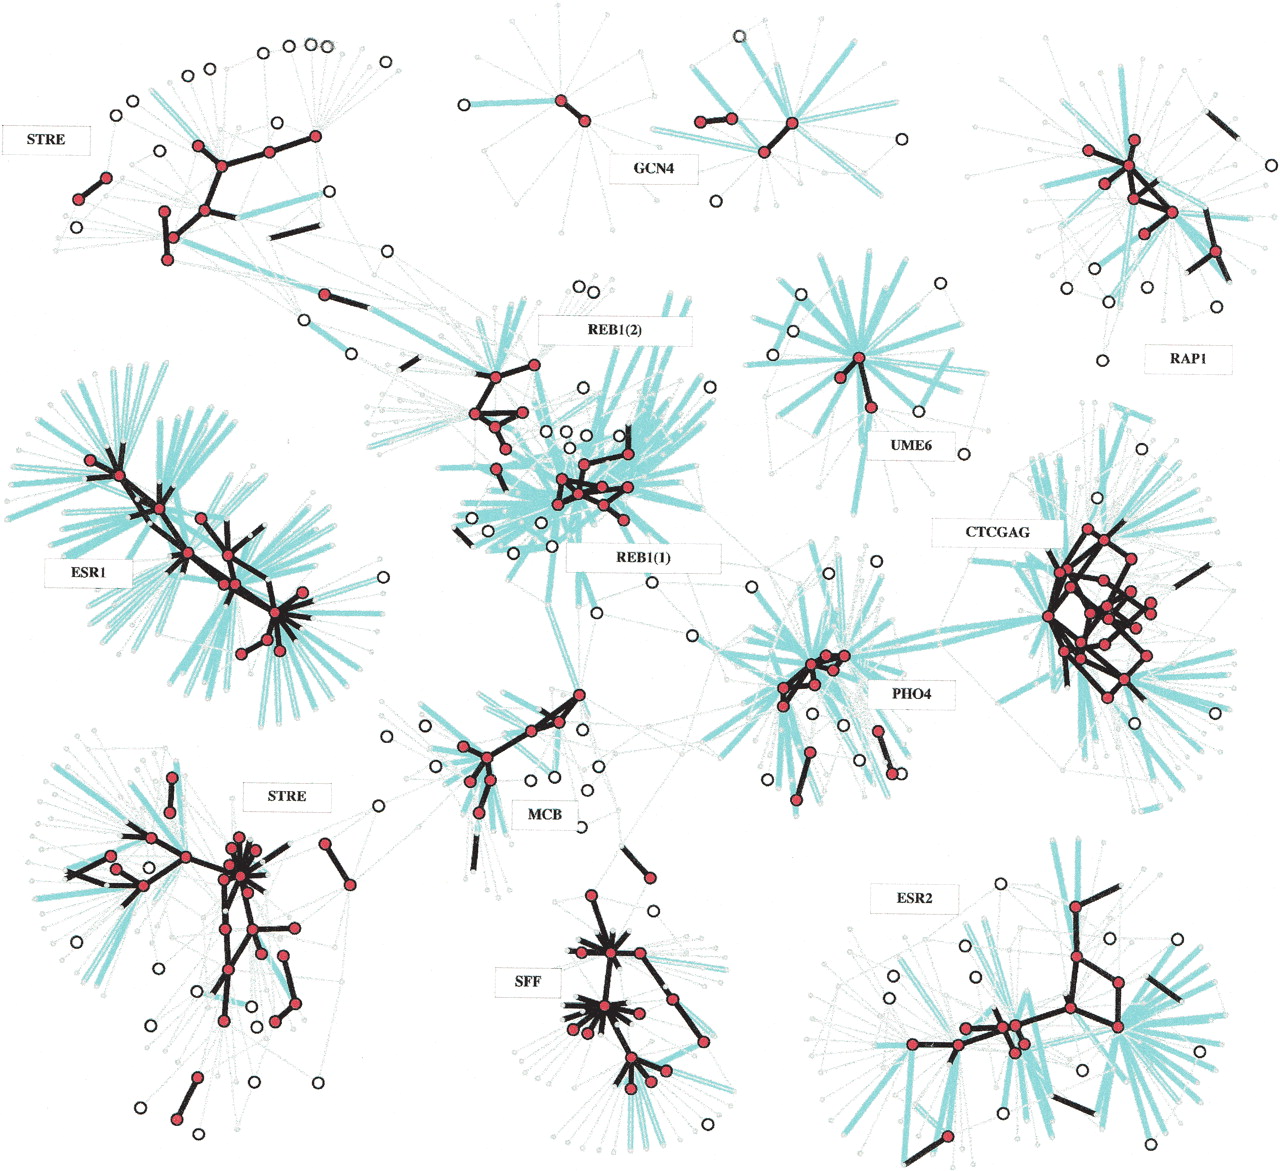
Partial view of the selection network. Motifs are represented as circles; motifs that have conservation rate >0.2 at 2 SD are drawn as large circles, motifs with conservation rate >0.2 at 3 SD are shown as large filled circles. Substitutions are shown as color-coded arcs. Black, nonnegative substitution rate (ρ > 0 and ρ > -0.5 at 2 SD); cyan, negative rates (ρ < -0.5 at 2 SD). A family in the selection network is a cluster of motifs that are interconnected via high or neutral substitution rate arcs. Low-rate substitution arcs separate families. Arc directions are not shown for readability, but 91% of the negative rate arcs point from a family motif to a motif outside the family. We annotated each family by a consensus motif, and by the names of the transcription factors that match that consensus (if such are known). Many known transcription factors are identified as families of motifs, some of which are shown in this figure. Families can be further analyzed for intricate intrafamily relations. Certain transcription factors (e.g., Reb1) correspond to more than one family due to multiple functionalities, as discussed later. Transcription factors with binding sites that are less frequent in the genomes (e.g., Gcn4) have larger variance on rate estimations, and thus are harder to cluster robustly. An interactive version of this figure is available on our Web site.


