
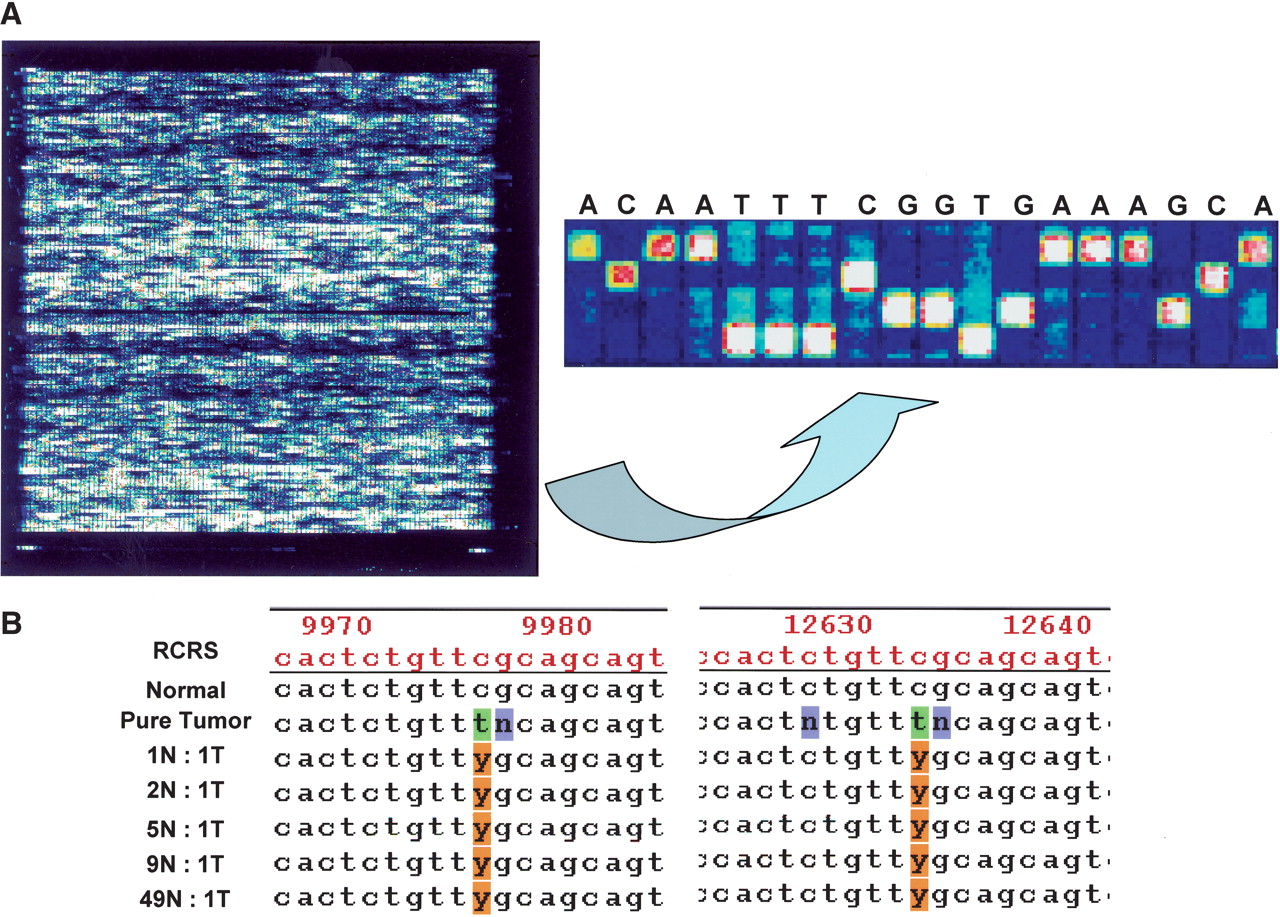
(A, left panel) Pictorial depiction of MitoChip hybridization data (.DAT file) after scanning in an Affymetrix Microarray suite; control tiles at the four corners of the chip permit automated grid alignment, which generates a .CEL file for subsequent batch analysis in GDAS. (right panel) Higher-magnification view of the tiling pattern on the MitoChip demonstrating the four alternative oligonucleotides (25mers with the 13th base being A, C, G, or T) for each RCRS base position, and the sequence-specific hybridization occurring at each position. All base calls are homozygous in the illustrated panel. (B) Serial dilution experiments performed with a primary lung cancer (JHU_MITO #12) and its corresponding normal DNA sample demonstrate the ability of the MitoChip to detect an aberrant clonal population in 50-fold-diluted tumor DNA. The sequence output is generated in GDAS, and the mutation detected corresponds to RCRS13197 C>T mutation in the tumor sample (Table 3). As illustrated, the mutation is detected at both positions for RCRS13197 on the MitoChip. Note that nucleotides immediately 3′ and 5′ of the mutated base position often result in a “no call” (N) due to poor hybridization quality scores caused by the mismatched base. The numbers depicted on the GDAS chromatogram correspond to the tiled base positions on the MitoChip and not the actual RCRS position. A convenient Excel-based conversion table linking the duplicate MitoChip positions to the RCRS nucleotide position is available from the authors on request. (N, normal; T, Tumor; Y, C+T in IUPAC ambiguity code)


