
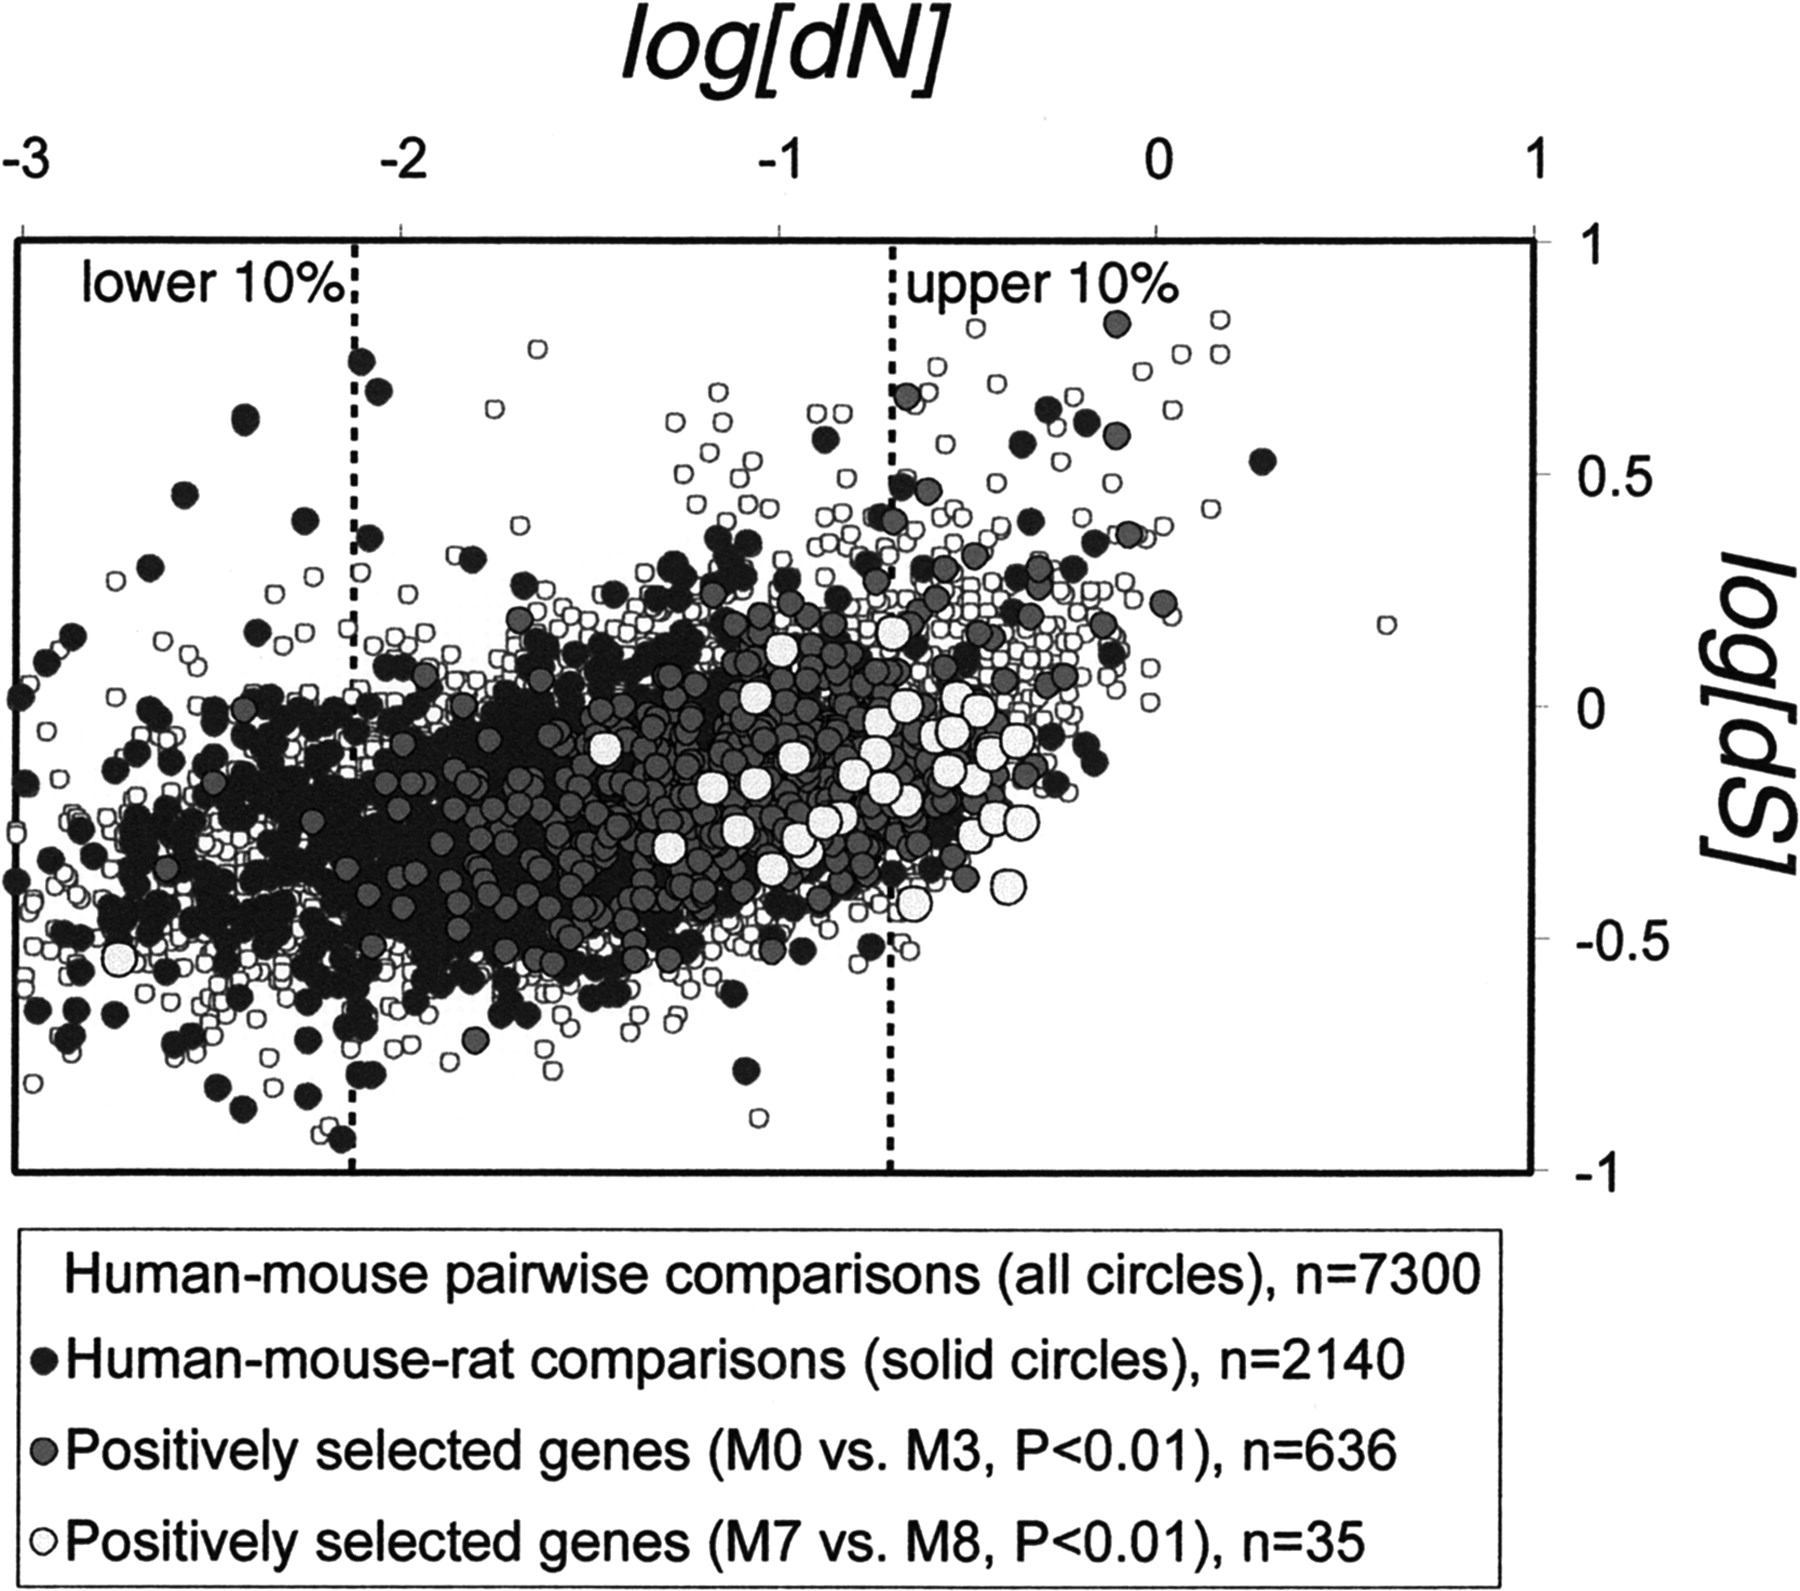
Figure 3
Scatterplot of dN versus dS for pairwise human–mouse comparison (all circles). Pairwise values of dN versus dS of the subset of genes tested for positive selection using rat sequences are shown as solid circles. Dark circles indicate genes putatively under positive selection according to the M0/M3 LRT criterion (P < 0.01). Light circles indicate genes putatively under positive selection according to the more conservative M7/M8 LRT criterion (P < 0.01).


