
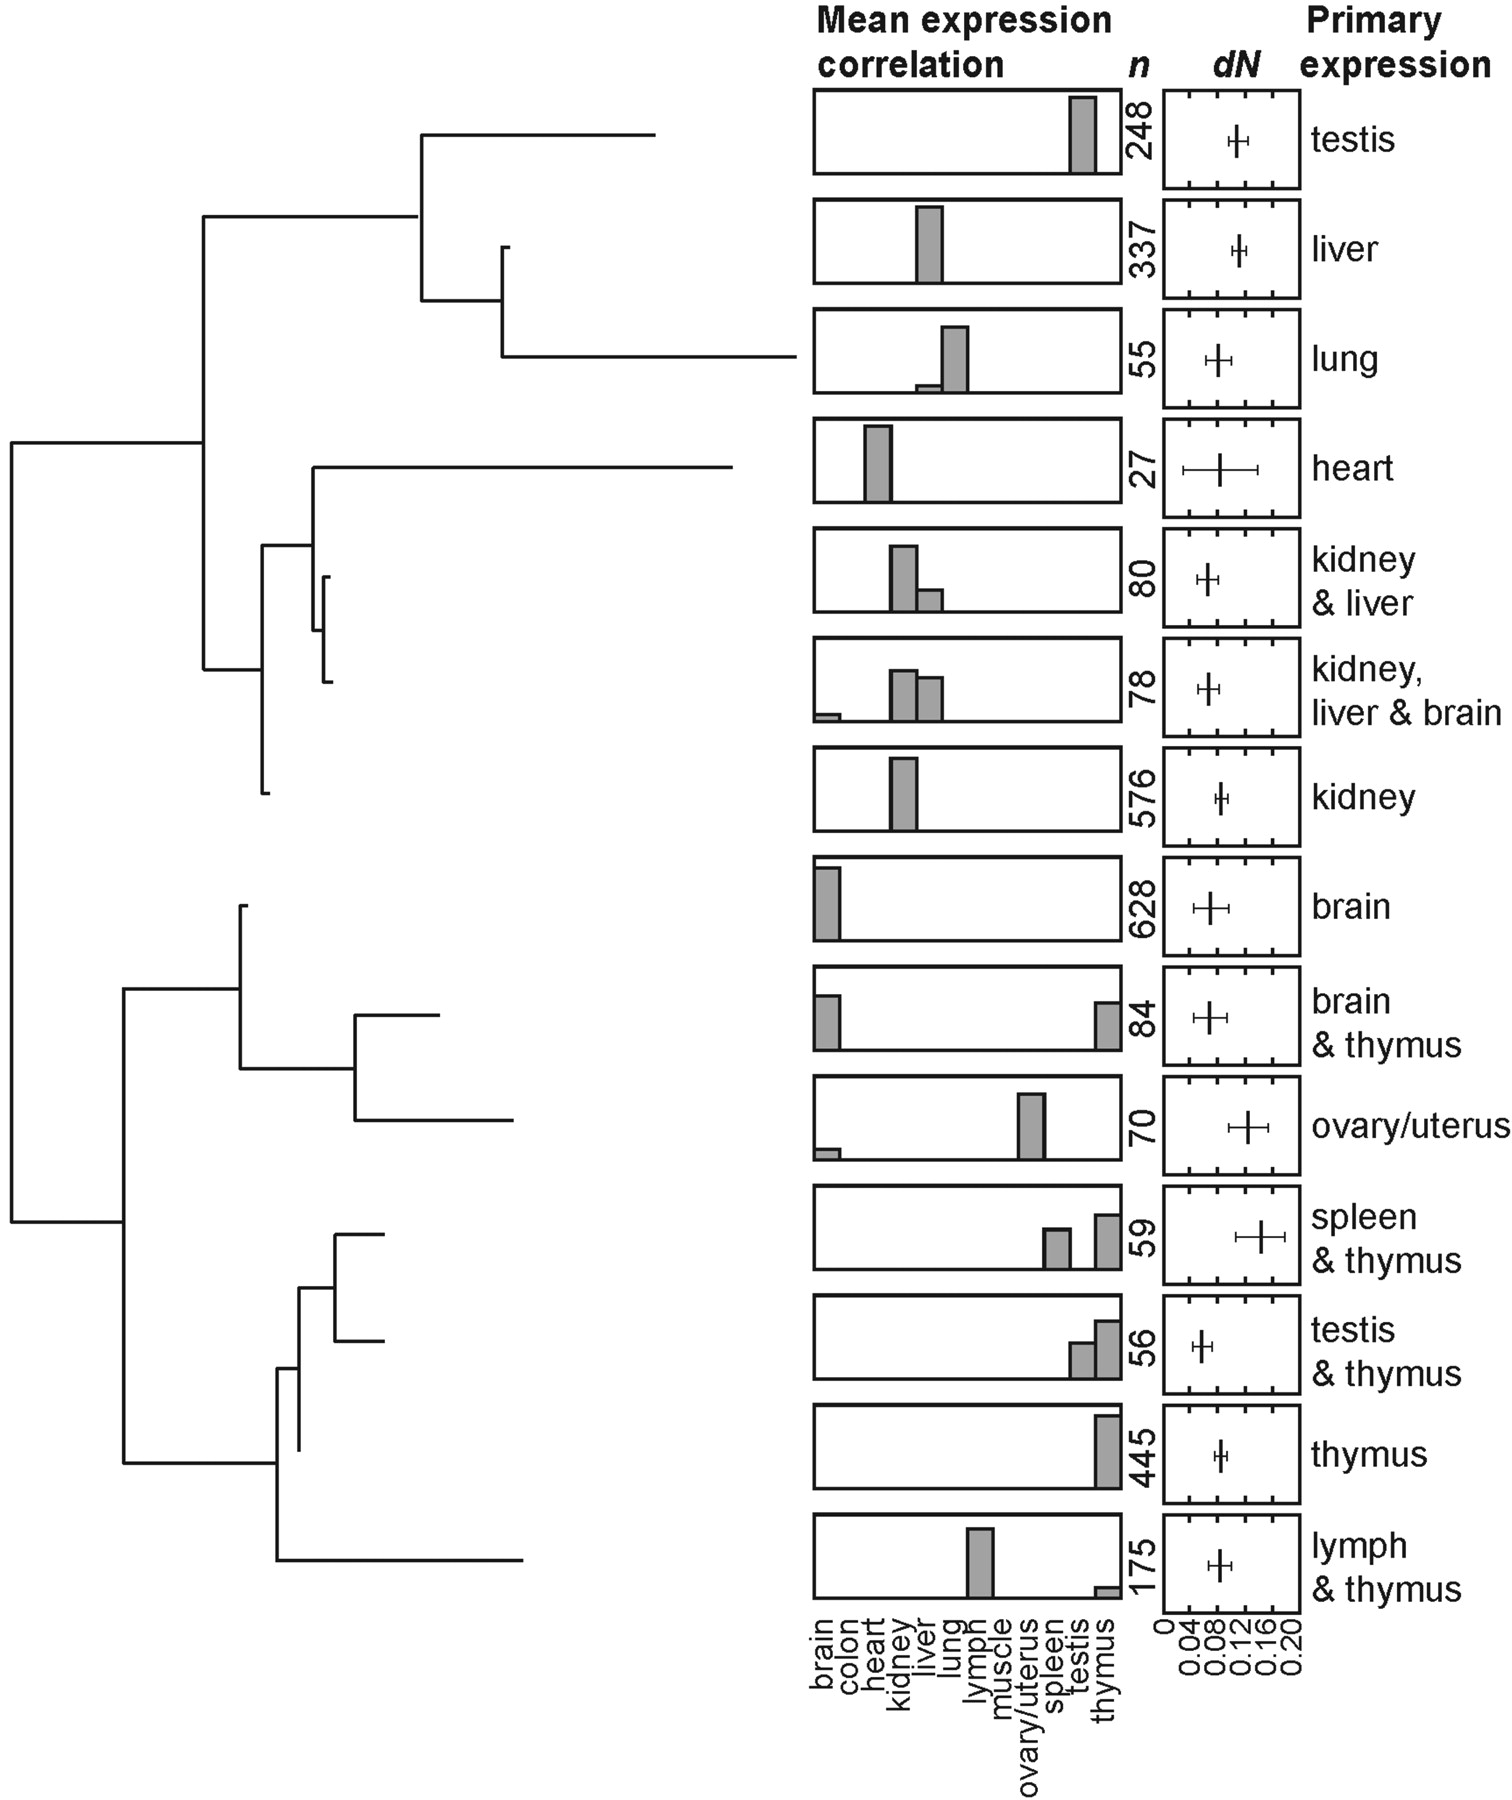
Figure 2
Tissue-specific gene expression SOTA tree and associated protein divergence estimates for genes expressed in each cluster. Histograms show the mean correlation coefficient for each tissue within a cluster and ranges from 0 to 1. Divergence is given in terms of dN; bars indicate 95% confidence intervals for each cluster as determined by nonparametric bootstrap replication, 1000 replicates.


