
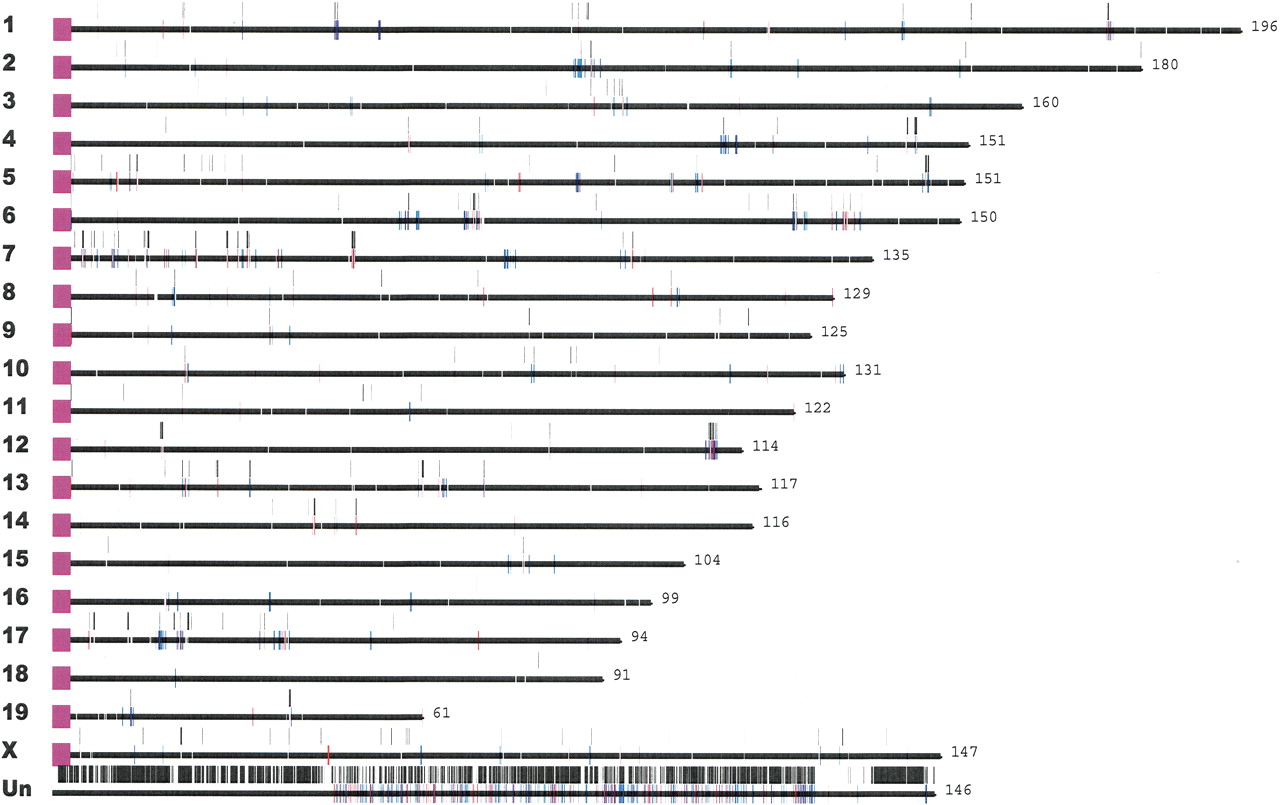
Figure 5
Mouse segmental duplications. Segmental duplications detected by whole-genome shotgun sequence detection (WSSD, black bars) and whole-genome analysis comparison (WGAC, red/blue bars) are drawn to scale within the published mouse genome assembly (MGSC 2002). Chromosome lengths and the centromere positions are shown in purple. These data are available as part of an interactive mouse segmental duplication database (http://mouseparalogy.cwru.edu).


