
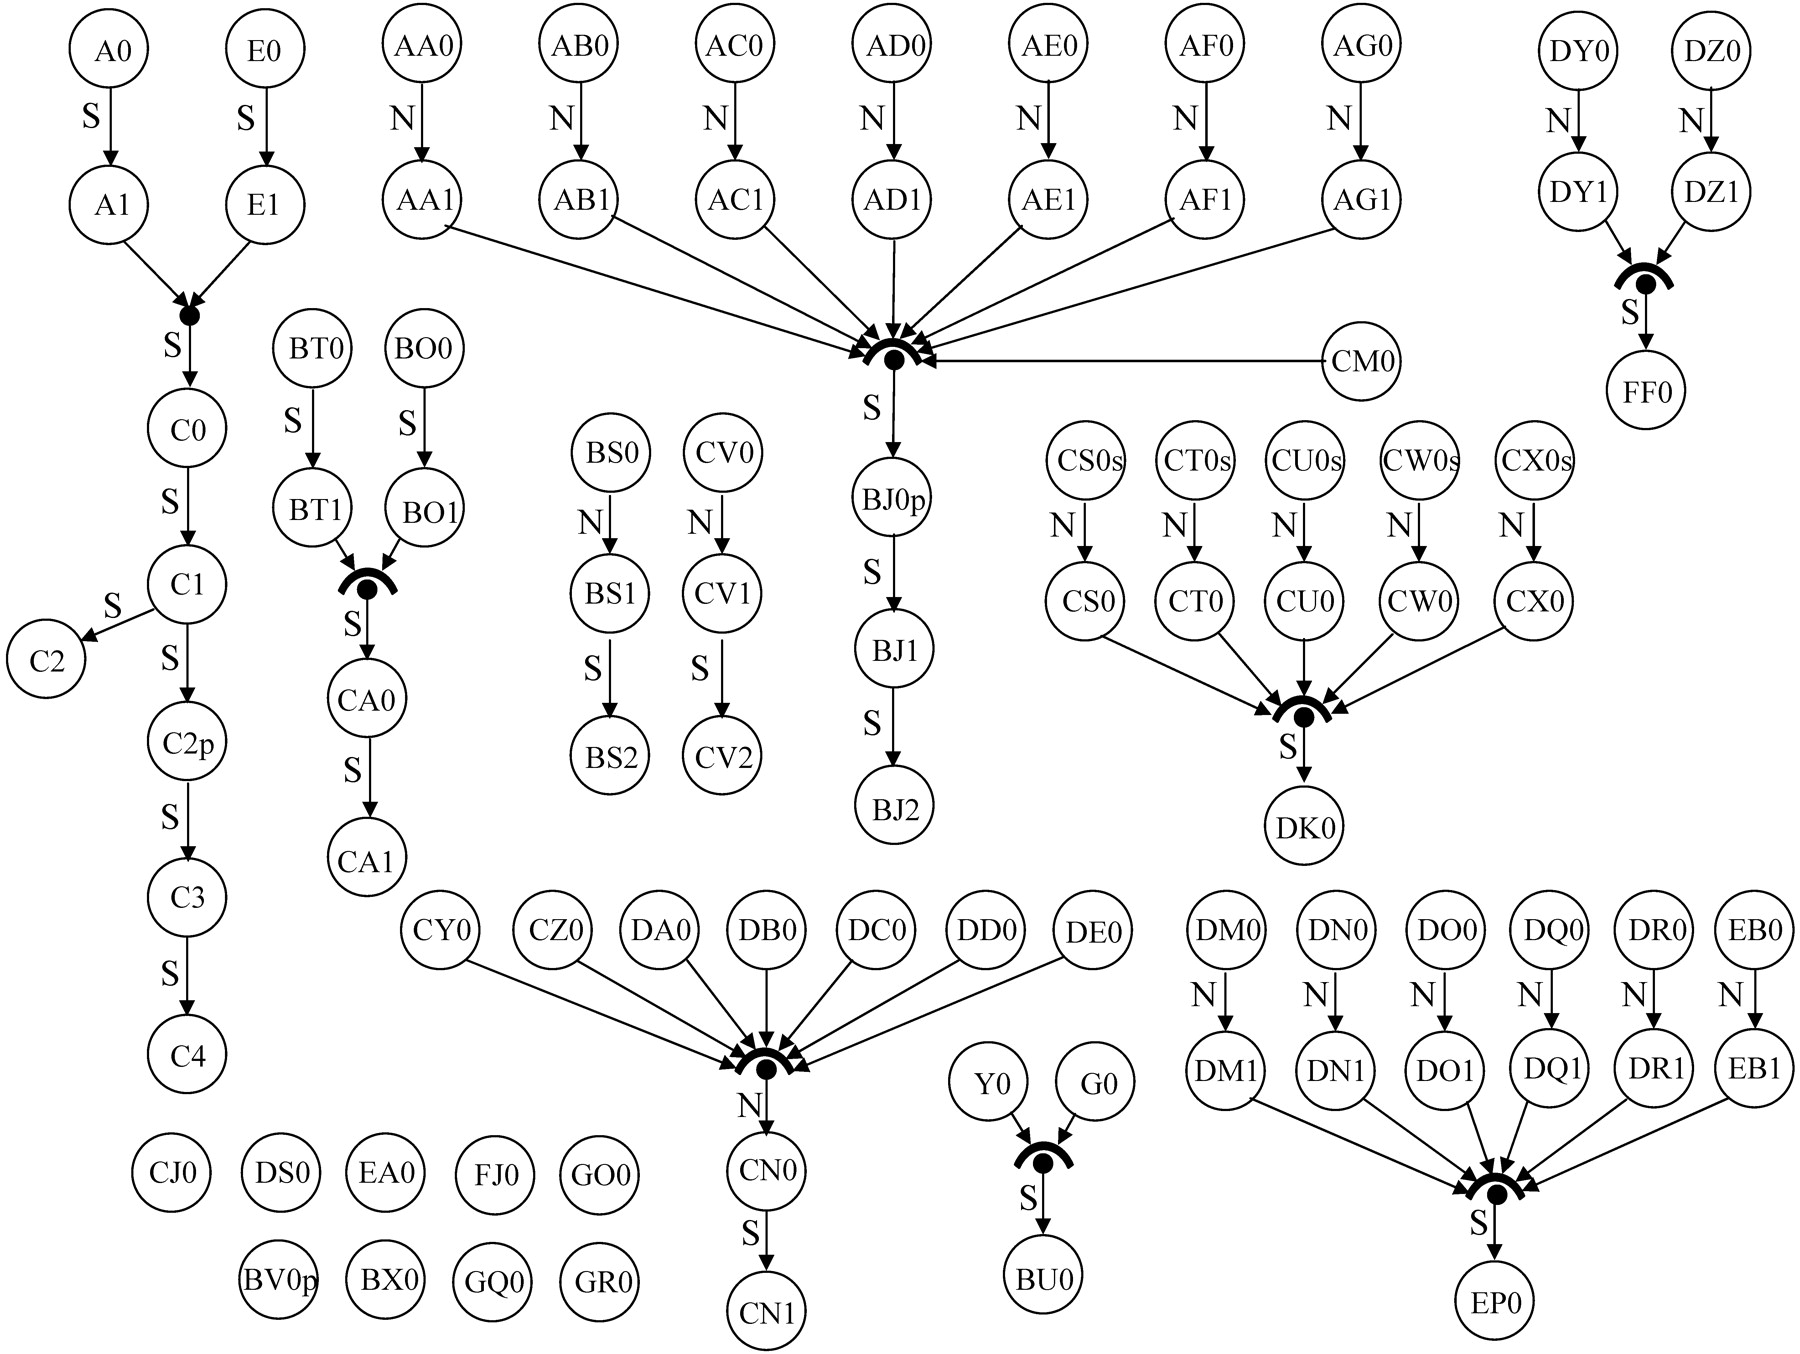
Figure 1
Summary of libraries created. This figure presents a graphical description of the cDNA libraries created throughout the gene discovery process. The operation of cDNA library normalization is represented by arrows labeled with an “N,” and serial subtraction operations are represented by arrows labeled with an “S.” Pooling of libraries is represented by multiple arrows converging on a single node.


