
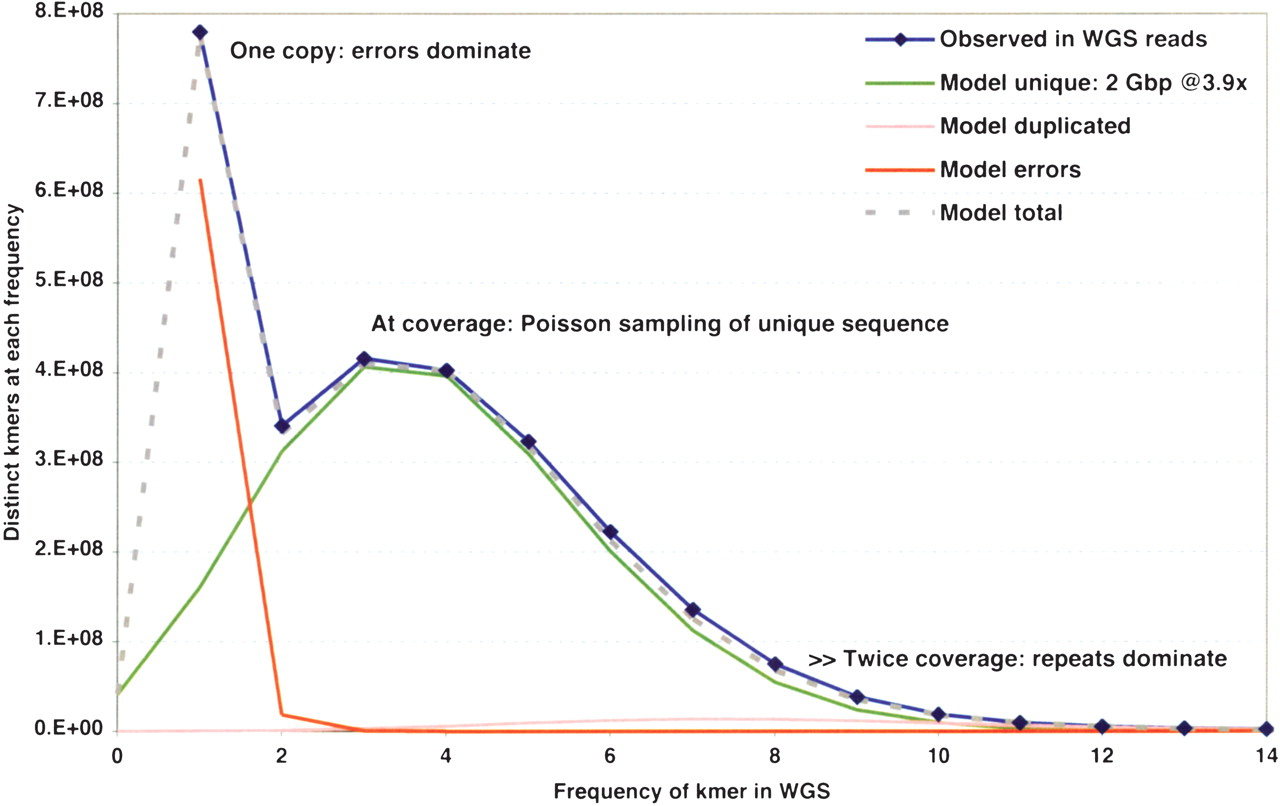
Figure 3
k-mer analysis of WGS reads in the RGSP. The frequency distribution of distinct 32-mer oligonucleotides is shown. The observed distribution is shown as a blue line, and the predicted Poisson distribution of unique 32-mers at 4 × shotgun sequencing coverage is shown as the green line. Models for unique 32-mers resulting from sequencing errors, 32-mers in duplicated regions, and the total 32-mer distribution from these models are shown as orange, pink, and dotted lines.


