
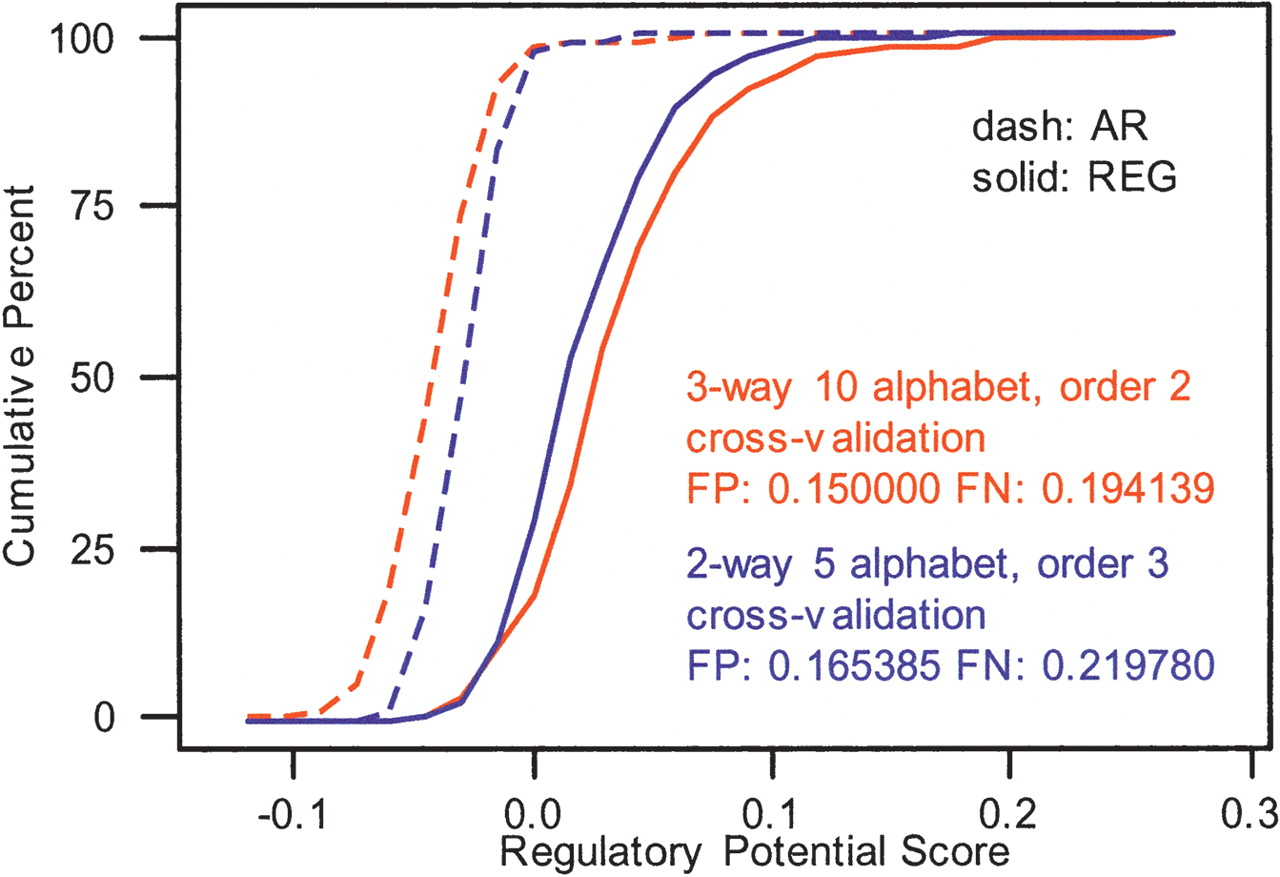
Figure 1
Cumulative distributions for two-way (blue) and three-way (red) RP scores on C(W)REG and C(W)AR. The text box contains the corresponding misclassification rates from leave-one-out cross-validation. Scores are all length normalized to correct for the slightly different sizes of the training segments (all around W = 100 bp).


