
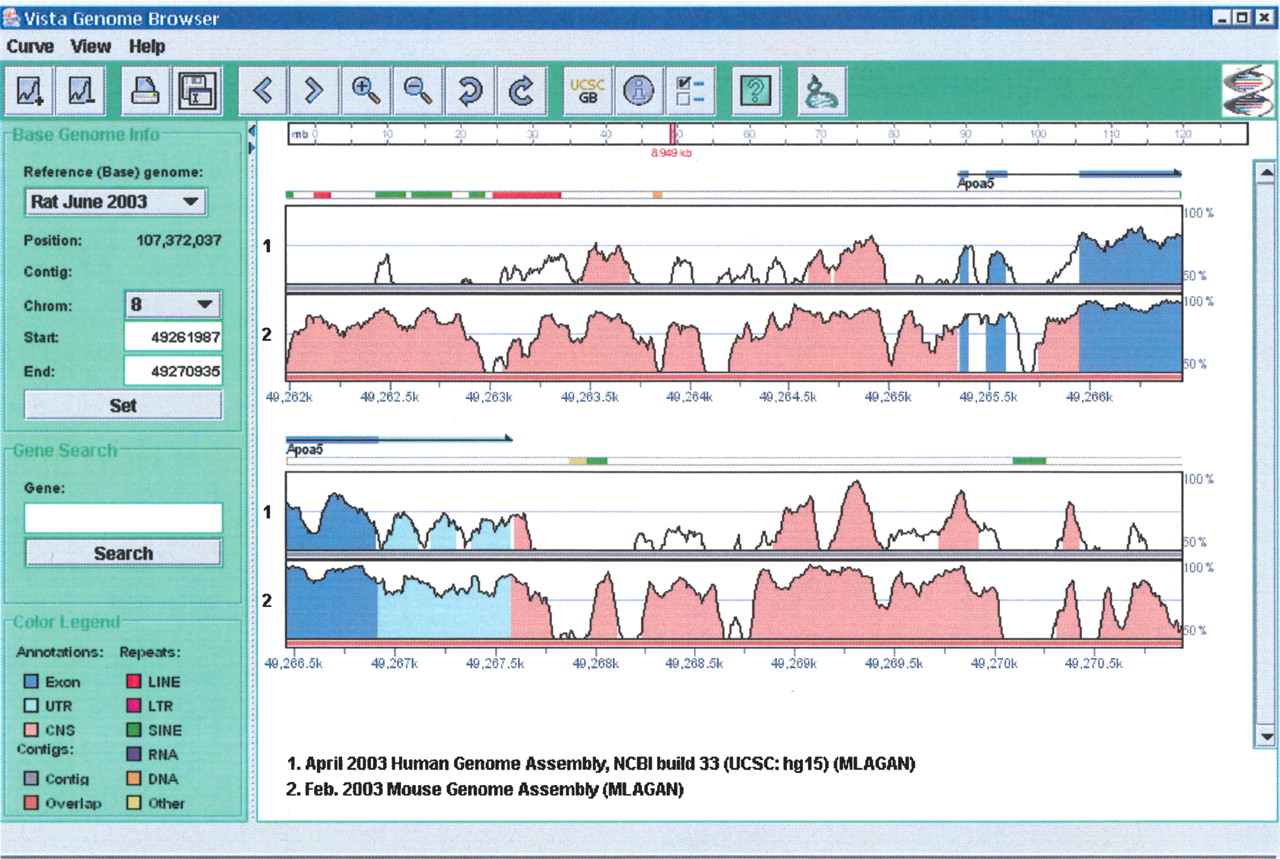
Figure 4
APOA5 region (chr8:49261987-49270935) on the Rat Genome (June 2003, RGSC version 3.1, University of California, Santa Cruz, version rn3) displayed by Multi-VISTA Genome Browser (VGB2.0) accessible through the gateway at http://pipeline.lbl.gov. Conservation plots for human/rat (top plot) and mouse/rat (bottom plot) are displayed on the scale of the rat sequence. Conserved regions above the level of 70%/100 bp are highlighted under the curve, with red indicating a conserved noncoding region; blue, a conserved exon; and turquoise, untranslated region.


