
Figure 1
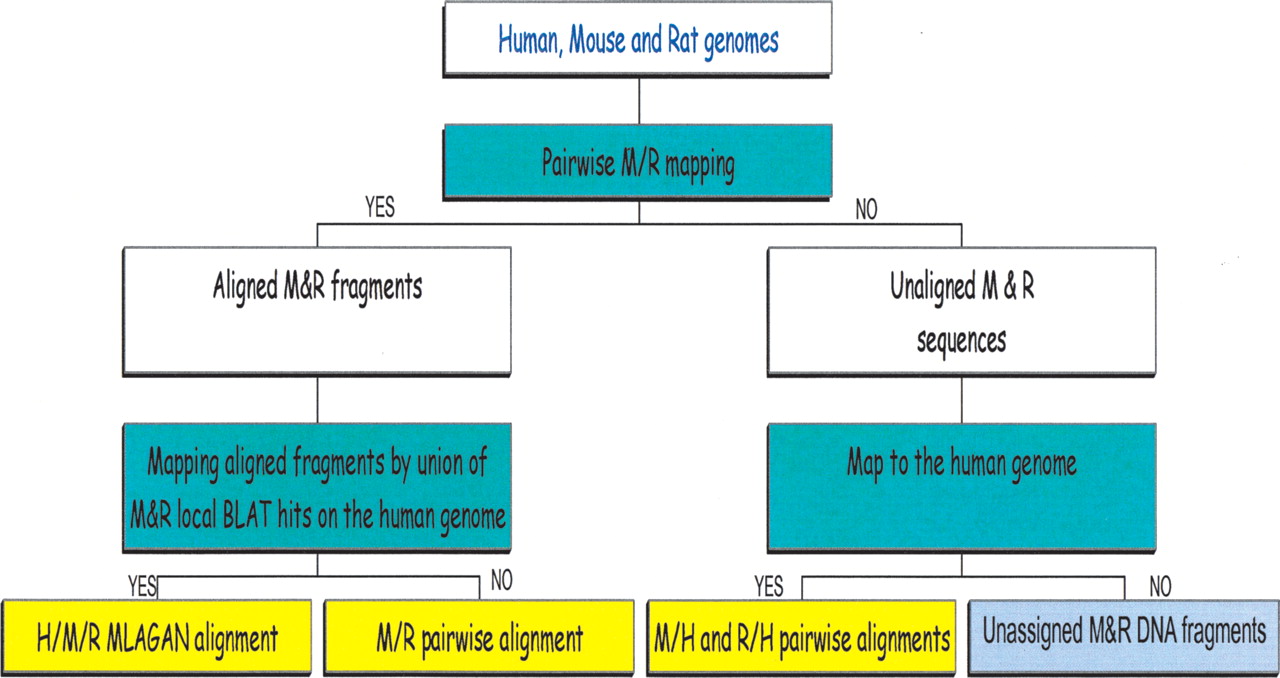
General scheme of the method. White boxes show original and intermediate data; green boxes, mapping/alignment steps; and yellow and grey boxes, resulting data.
(Downloading may take up to 30 seconds. If the slide opens in your browser, select File -> Save As to save it.)
Click on image to view larger version.
General scheme of the method. White boxes show original and intermediate data; green boxes, mapping/alignment steps; and yellow and grey boxes, resulting data.
 CiteULike
 Delicious
 Digg
Digg Facebook
 Google+
 Reddit
 Twitter
