
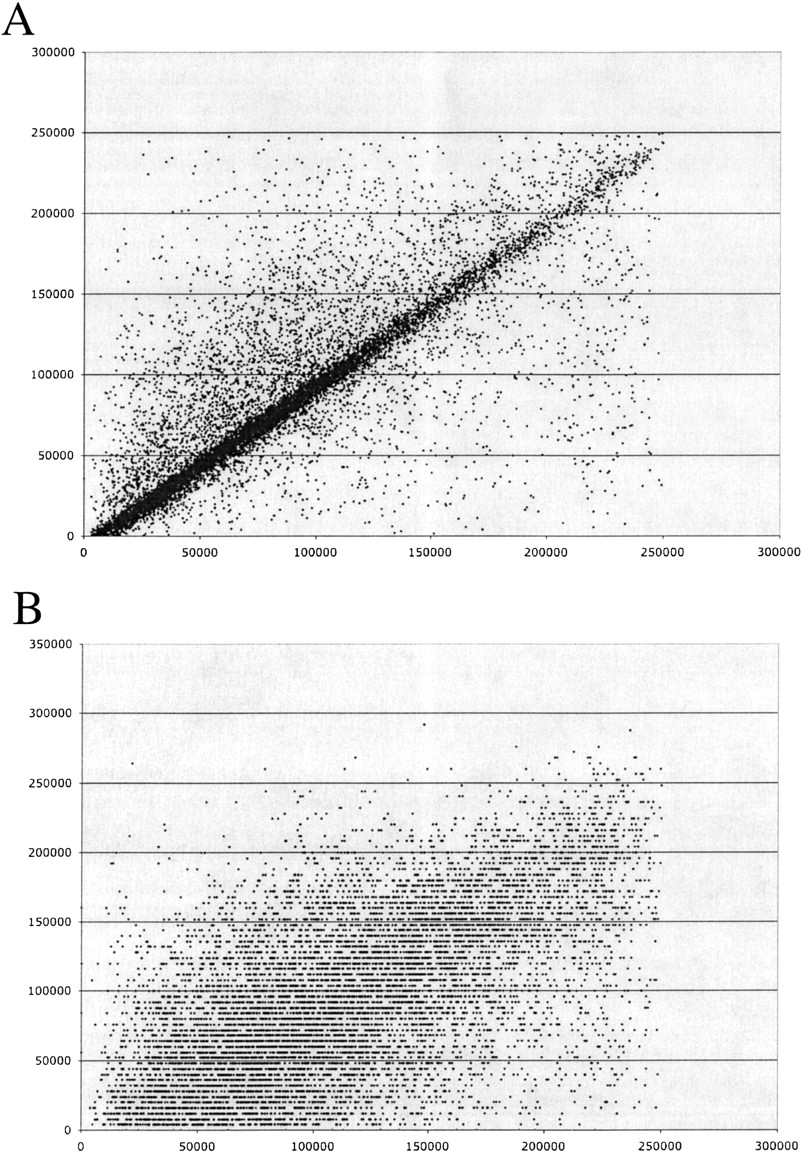
Figure 3
Scatterplots of the estimated clone overlap against overlap obtained from the sequence of overlapping seed clone pairs. The horizontal axis is the overlap between a seed clone pair based on their final sequence. The vertical axis is the overlap estimated based from (A) BAC end reads or (B) the FPC assembly.


