
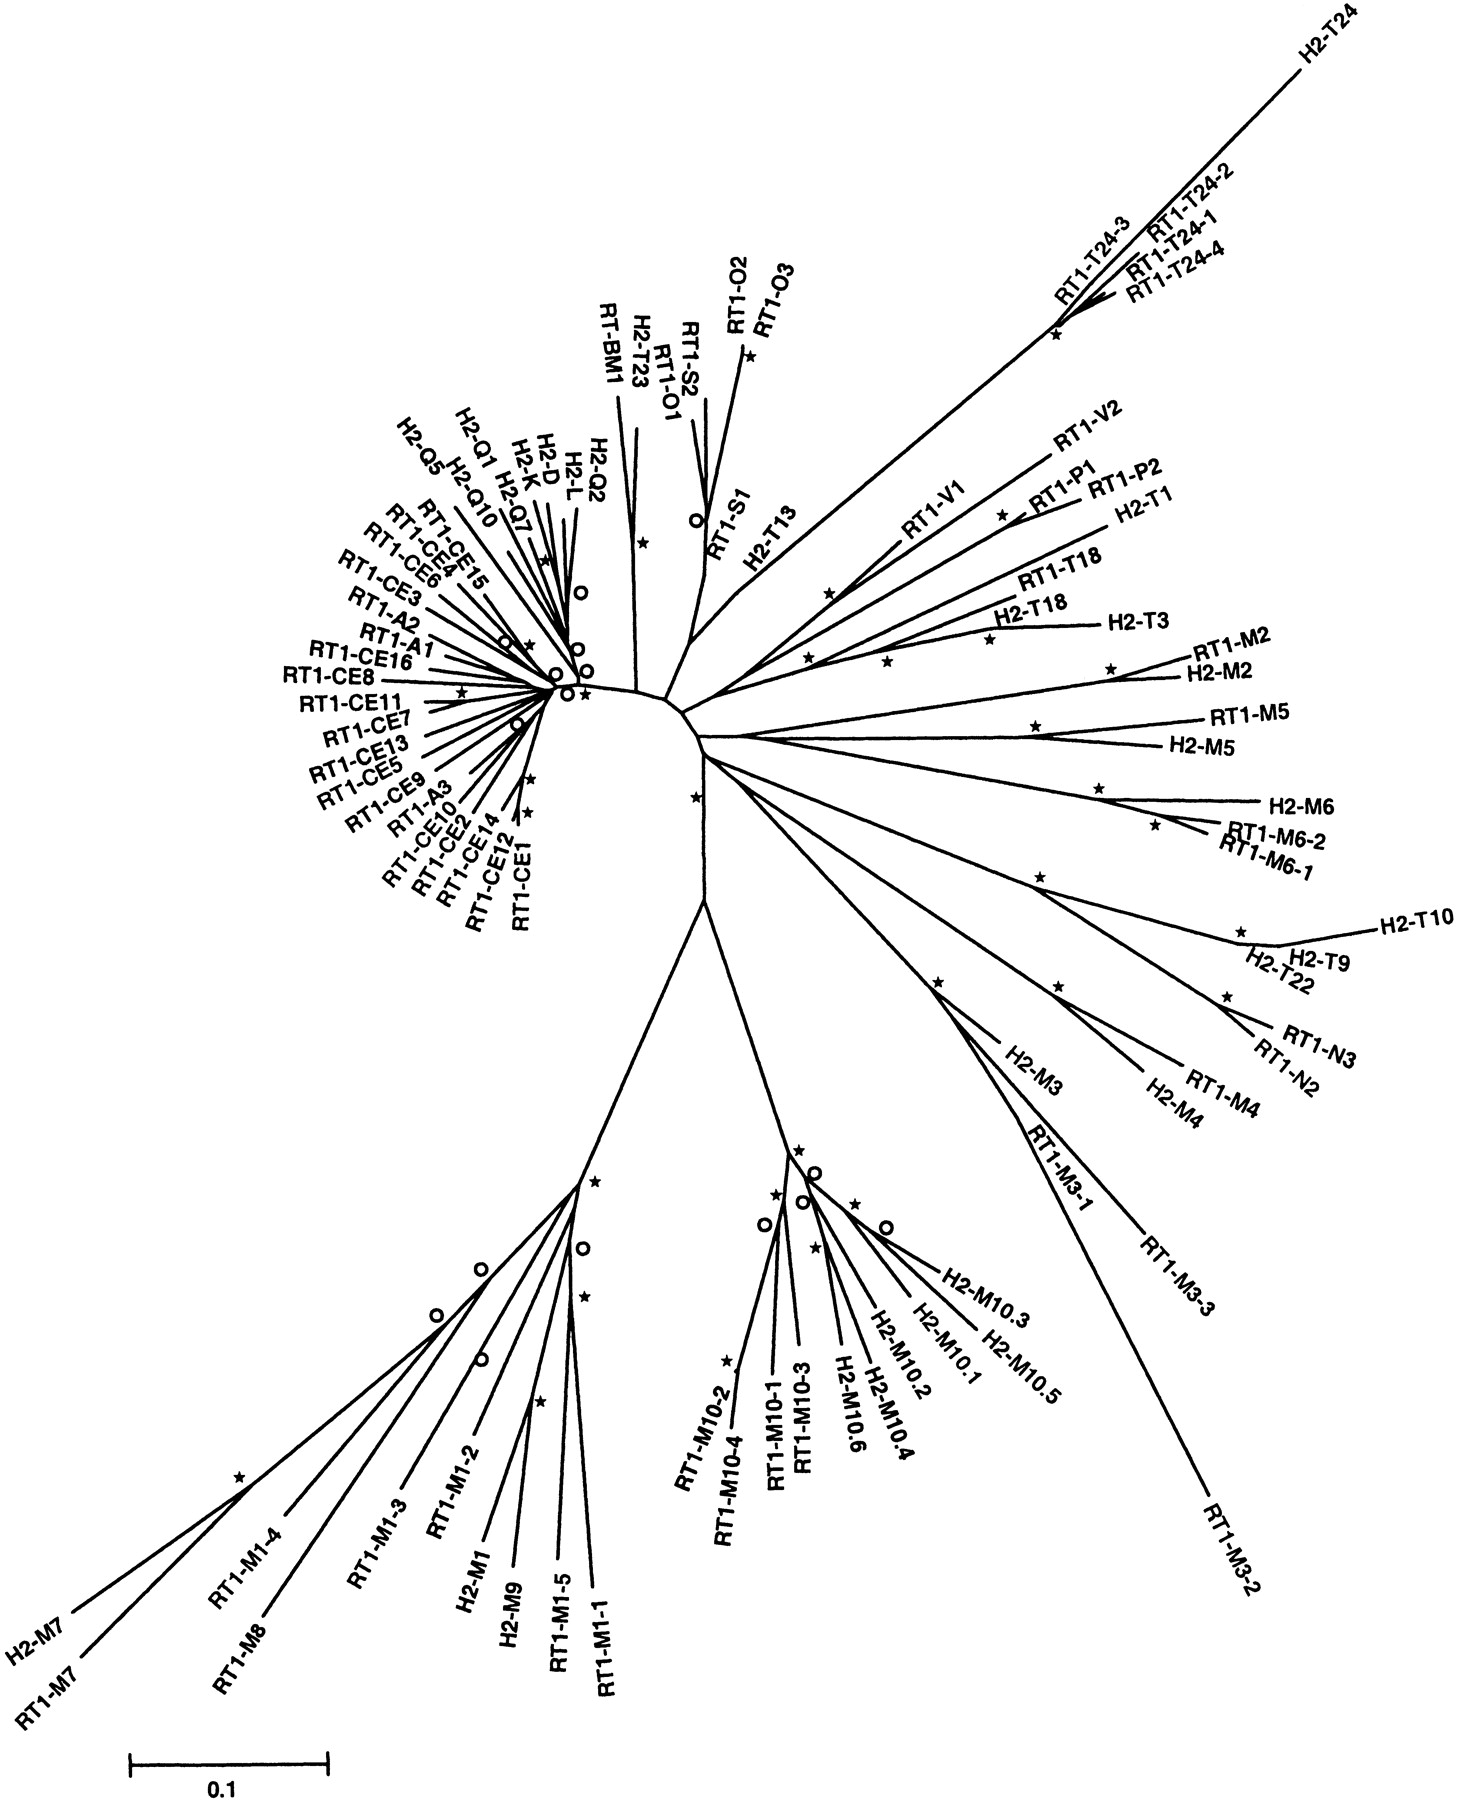
Phylogenetic tree analysis of rat class I genes identified in the RT1n genomic sequence determined by us, combined with mouse class I gene sequences (rat gene prefix RT1; mouse gene prefix H2). Noteworthy are the species-specific amplification of A and CE genes in rat and H2-K, -D, -L genes in mouse. The class I genes in the rat N, mouse T, and in the M-gene regions of both species show clear orthology, with radiation in some cases that took place after species divergence, for example, the RT1-T24 and RT1-M10 families. A minimum evolution tree was generated by calculating Jukes-Cantor distance based on class I gene exons 2–8. Asterisks and open circles indicate bootstrap levels (500 replicates) of ≥95% and ≥70%, respectively.


