
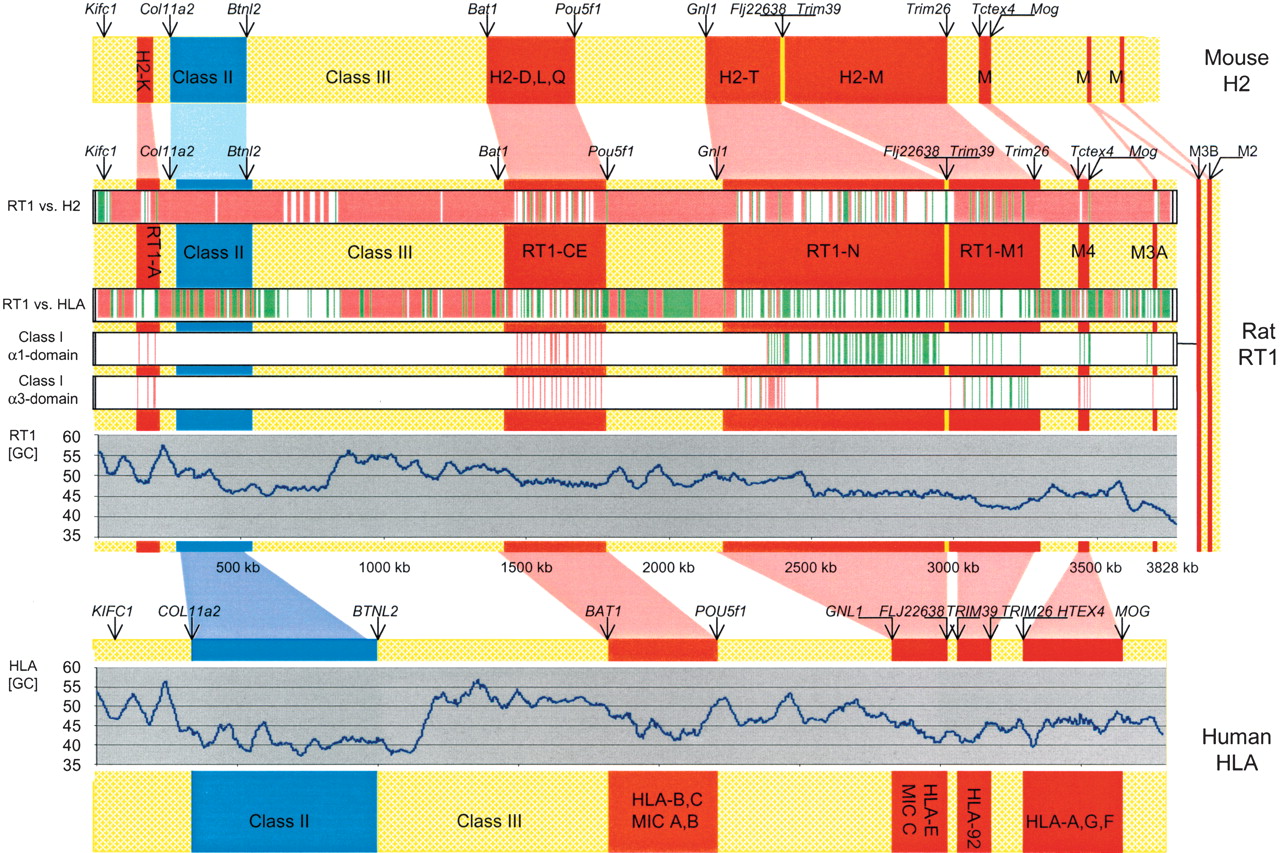
Comparative analysis of structure and sequence of the MHC region in mouse H2 (top), rat RT1 (center), and human HLA (bottom). We detected considerable differences in the size of orthologous regions in rat, human, and mouse. Regions are color-coded, based on their gene content. Red, class I gene regions; blue, class II gene regions; yellow, framework gene regions including class III regions. Positions of selected framework genes, indicative of borders between class I, class II, and class III intervals and framework regions are shown. Four horizontal “heat map” bars embedded within the diagram that represent RT1 describe sequence features. RT1 vs. H2, comparison of 3.8-Mb RT1 sequence to H2. Finished sequence of the complete mouse MHC from a single haplotype is not yet available. We have therefore merged 1.7-Mb finished sequence from proximal H2 (haplotype bc; NT_002588) with whole-genome shotgun (WGS) draft sequence (haplotype b; NT_039650). RT1 vs. HLA, comparison of 3.8-Mb RT1 sequence to HLA (NT007592; segment 20-25 Mb). Class I α1- and α3-domain homologies were identified by rat RT1-Au gene exons 2 and 4, respectively (from U38972). Analysis was performed using PipMaker. Colors within “heat map” bars indicate the degree of conservation. Red, homology exceeds 70% in 100-bp interval. Green, homology between 50% and 70% within 100 bp. GC content for RT1 and HLA was calculated with a 50-kb window and a shift of 0.2 kb. The rat M3B/M2 region is unconnected to our major contig (indicated by thin line).


