
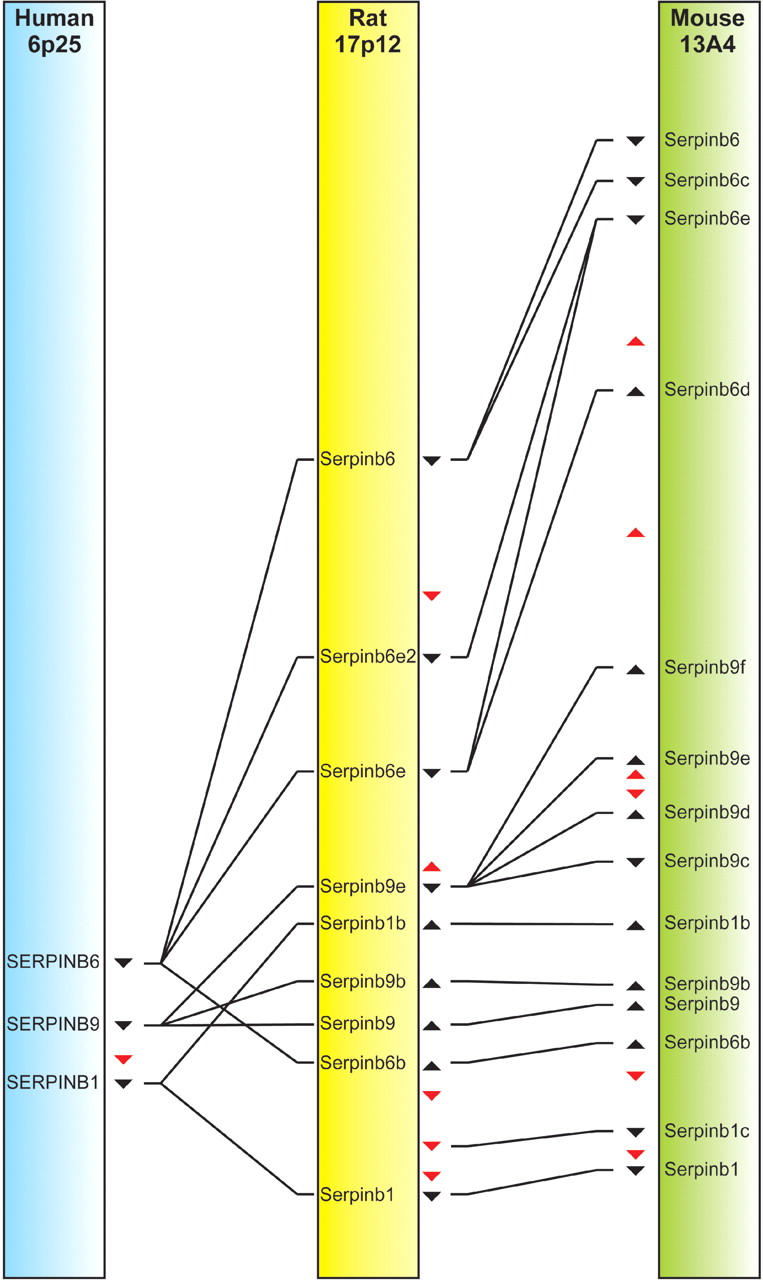
Figure 5
Comparative analysis of a cluster of rat serpins at 17p12 with the corresponding region of human and mouse genomes. The order and orientation of genes are indicated by black arrowheads, and pseudogenes are represented by red arrowheads. Orthology is indicated by connecting lines.


