
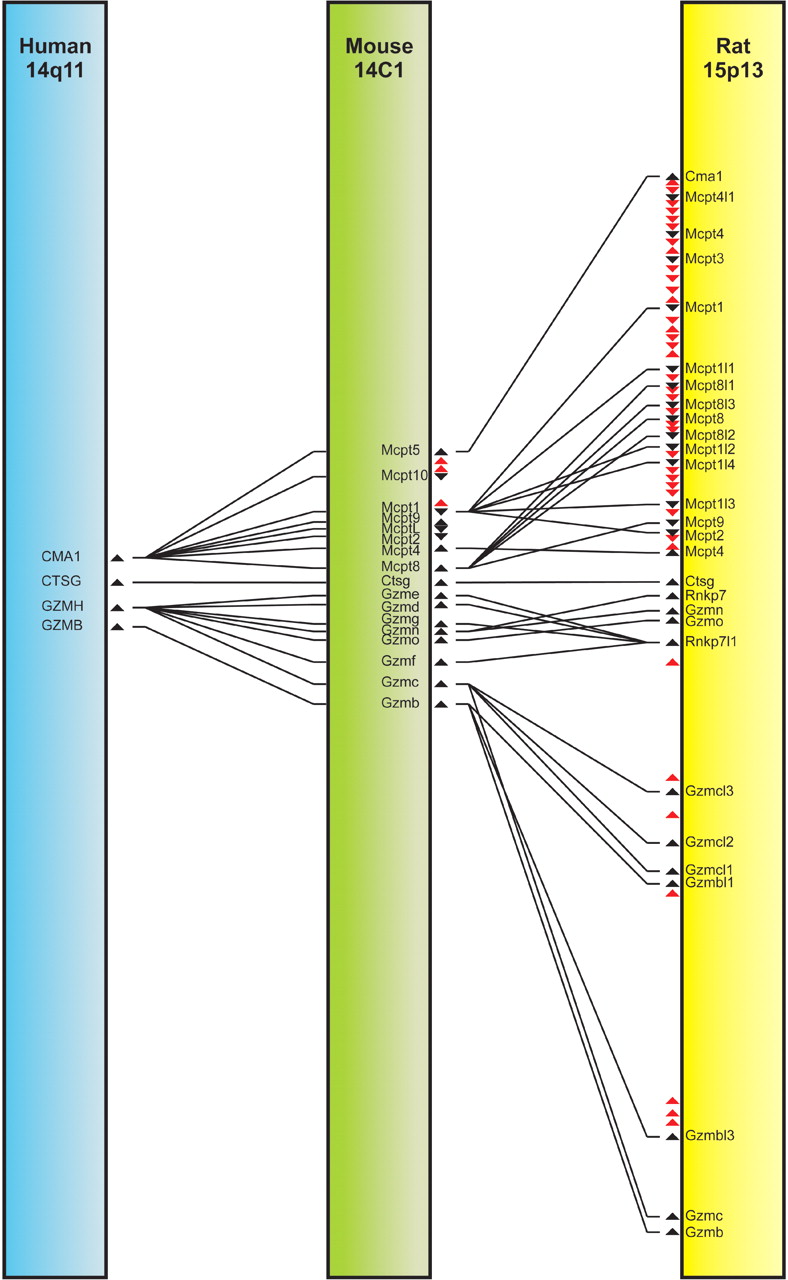
Figure 4
Comparison of rat hematopoietic serine proteases clustered at 15p13 with those of mouse at 14C1 and human at 14q11. Gene position and orientation are indicated by arrowheads; black ones represent genes, and red ones denote pseudogenes. Connecting lines indicate orthology or gene expansion.


