
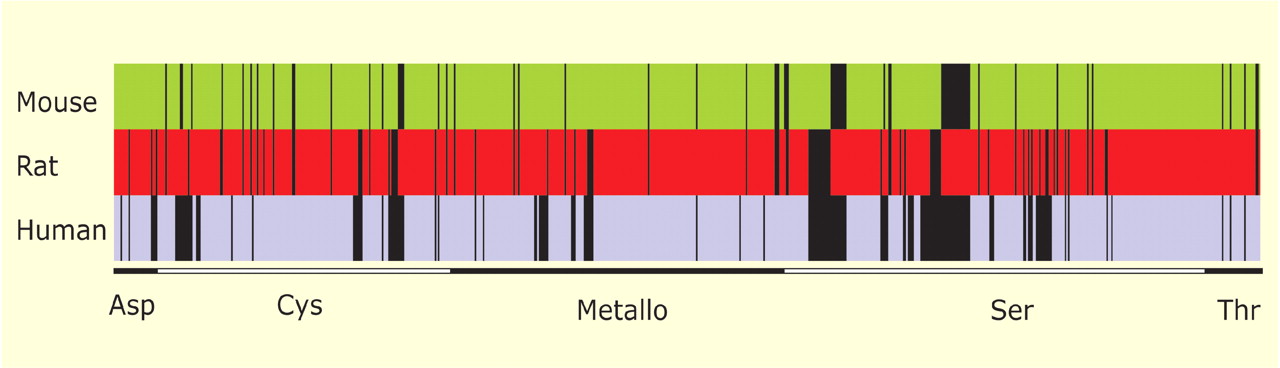
Figure 1
A global view of the rat degradome and comparison with those of mouse and human. The figure represents the complete set of proteases and protease–homologs from each species distributed into five catalytic classes. Proteases absent in one species are shown as black bars.


