
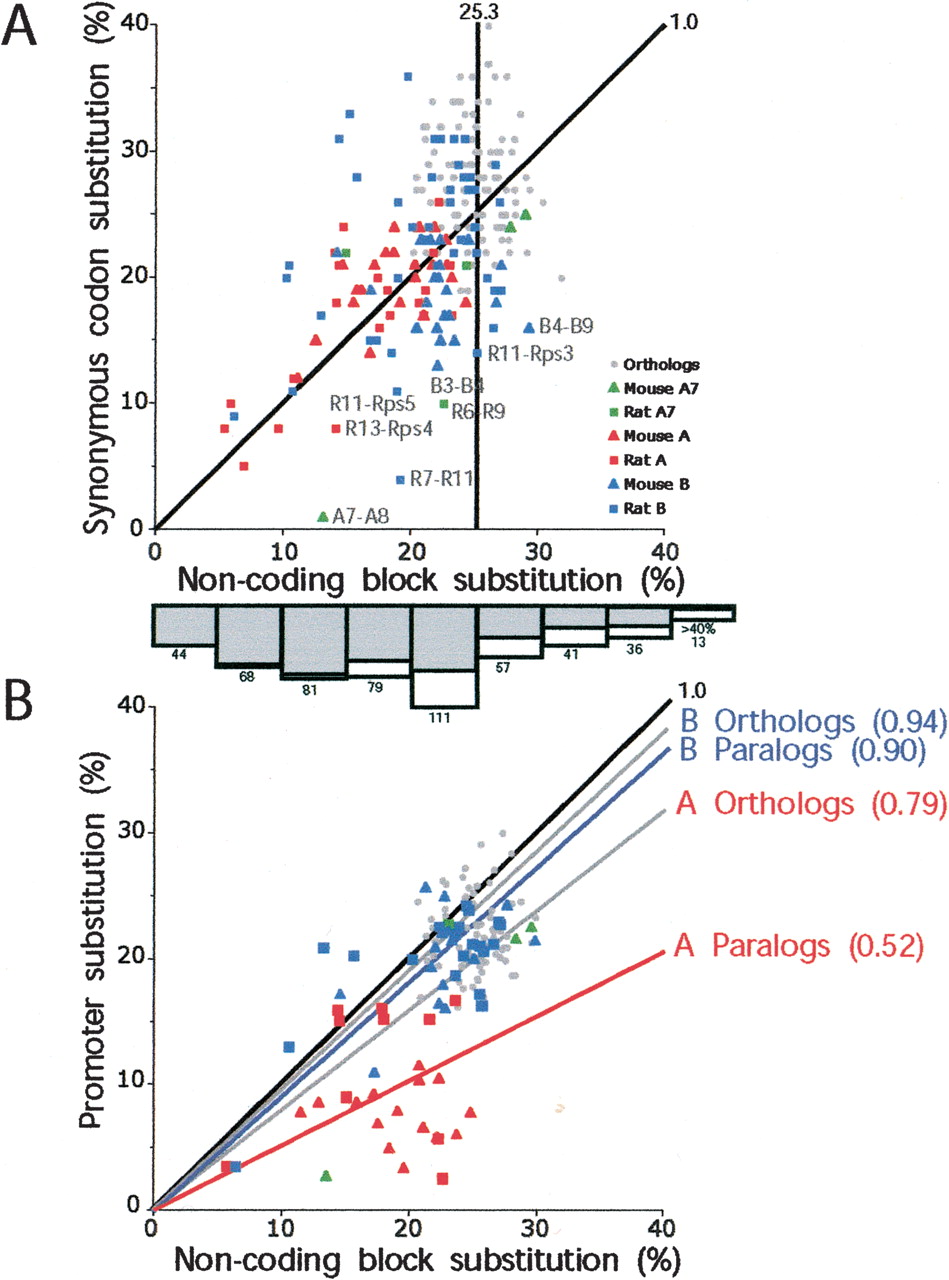
Scatterplots of substitution levels in pairwise comparisons within subfamilies of noncoding and coding regions (A) and noncoding and promoter regions (B). Noncoding block substitutions were calculated using RepeatMasked sequences not apparently under selection; thus, we excluded the conserved promoter regions, conserved coding regions, as well as regions immediately upstream of the coding regions (see Fig. 3). The substitution levels are Jukes-Cantor adjusted (Jukes and Cantor 1969) for multiple substitutions. For coding regions, we considered only substitutions in synonymous sites. Comparisons among A, B, and A7 subfamily paralogs are plotted in red, blue, and green, respectively; comparisons among mouse paralogs are plotted with triangles, and rat paralogs are plotted with squares. Cross-species intrafamily comparisons are plotted with gray circles. The diagonal black lines (slope = 1.0) indicate equal noncoding block and synonymous codon position (or promoter) substitution levels. (A) The average orthologous block divergence within subfamilies is indicated by the vertical line (25% ± 3%). The average paralogous block divergence within subfamilies is 20% (SD ± 5%; 25-th percentile = 17%, 50-th percentile = 22%, 75-th percentile = 24%). On the whole, B subfamily paralogous pairs (average = 22% ± 5%; 25-th percentile = 20%, 50-th percentile = 23%, 75-th percentile = 25%) exhibit greater divergence than A subfamily paralogous pairs (average = 18% ± 5%; 25-th percentile = 15%, 50-th percentile = 18%, 75-th percentile = 21%). Gene pairs that exhibit at least twofold difference in their synonymous and noncoding block substitution levels are labeled. The bar graph at the bottom of the A panel is the age distribution of L1 repeats that integrated in the mouse and rat loci as determined by RepeatMasker (% divergence from consensus, Jukes-Cantor-adjusted). The numbers of L1 repeats identified in each bin is indicated. The gray shading indicates the fraction of these L1s located between duplicated gene blocks. (B) The average orthologous and paralogous promoter:noncoding block substitution ratios are indicated for the A (red labels) and B (blue labels) subfamilies, respectively. These average ratios range between 0.52 (A paralogs) and 0.94 (B orthologs), indicating a range of apparent selective pressures. Note: most pseudogenes are missing the putative promoter sequence, and therefore, fewer pairwise comparisons are shown in B than in A.


