
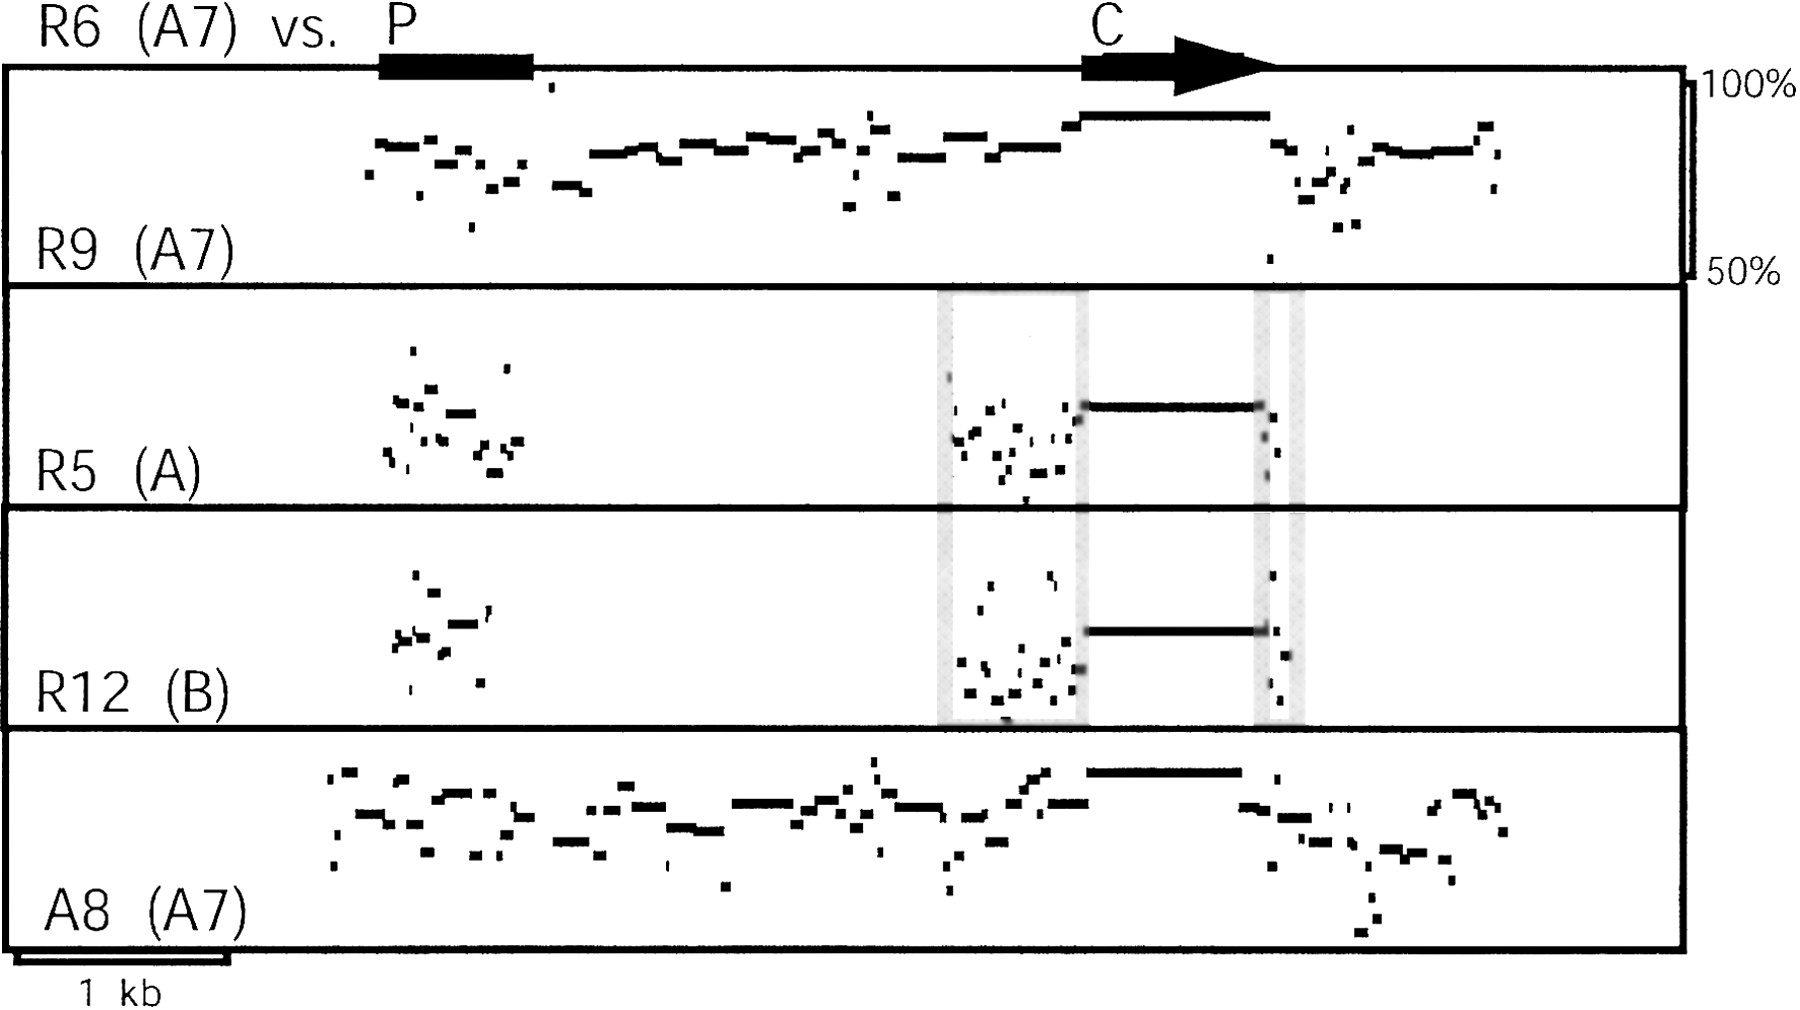
Figure 3
PipMaker plots of the rat R6 gene (A7 subfamily) versus the rat R9 (A7 subfamily), rat R5 (A subfamily), rat R12 (B subfamily), and mouse A8 (A7 subfamily) genes. Homology is plotted according to position and percent identity. Homology does not extend beyond the regions shown. The coding region (C) is indicated by a black horizontal arrow; note that sequences immediately surrounding the coding regions are also apparently under selection (outlined gray in cross-subfamily comparisons). The conserved promoter regions (P) are indicated by a black bar.


