
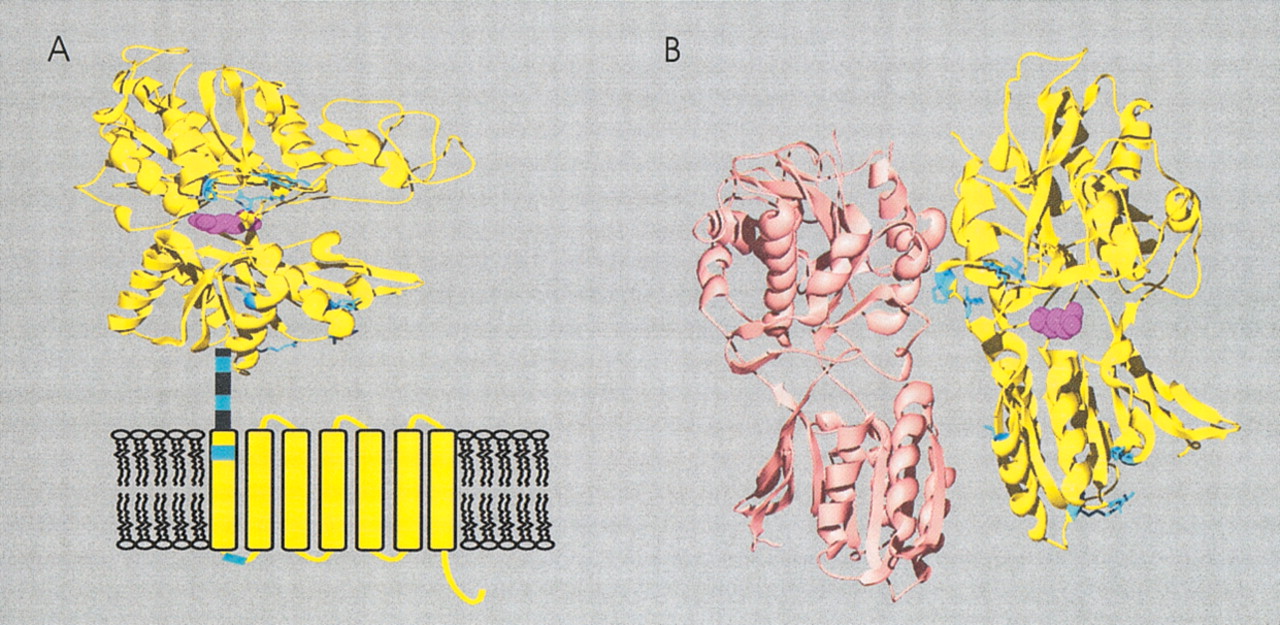
Figure 2
Site-specific KA/KS analysis for V2Rs. (A) Ribbon diagram showing ω+ sites. (B) Representation of the extracellular domain of metabotropic glutamate receptors with mapped ω+ sites. Predicted ω+ sites are mapped as described in Figure 1 and colored blue. Residues are mapped to the structure of rat metabotropic glutamate receptor subtype 1 complexed with glutamate here colored purple (PDB 1EWK, Kunishima et al. 2000). ω+ sites in the carboxy-terminal domain were mapped to the secondary structures of bovine rhodopsin 1EWK (for full details see Suppl. Table 2).


