
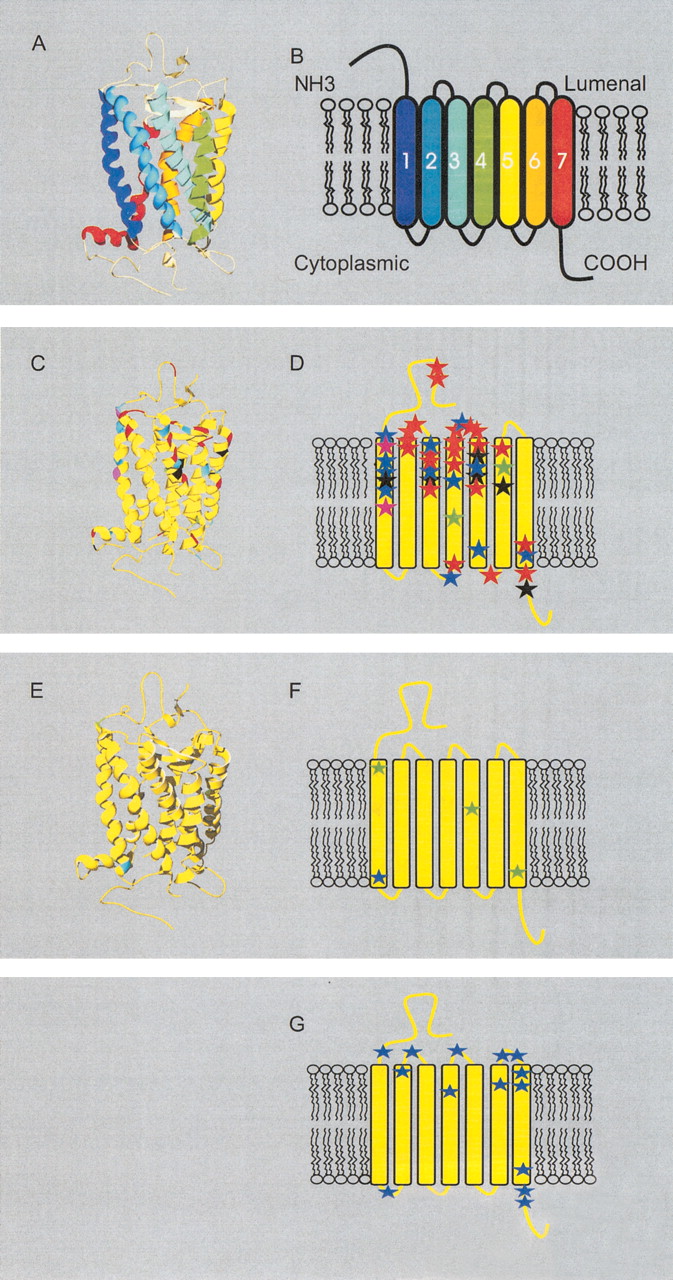
Site-specific KA/KS analysis of olfactory receptors, candidate testis odorant receptors, and V1Rs. ω+ codons that were predicted to be under positive selection are mapped to a ribbon representation of the structure of bovine rhodopsin (PDB 1L9H; Okada et al. 2002; for full details see Suppl. Table 2). (A) Ribbon diagram of bovine rhodopsin chain A colored by secondary structure succession. (B) Schematic representation of secondary structures. Ribbon diagram (C) and secondary structure schematic (D) of ω+ sites for olfactory receptors. ω+ sites predicted for OR family A are highlighted in green, B in black, C in purple, D in blue, and E in red. The analysis of these ORs indicates that positive selection appears to be confined largely to the lumenal half of the molecule. Seventy-five percent of the ω+ sites are located in the amino terminal region, extracellular loops, and the extracellular half of the transmembrane helices. Ribbon diagram (E) and secondary structure schematic (F) of ω+ sites for the candidate testis-specific odorant receptors (posterior probability > 0.99, in a single model). Three ω+ sites identified when analyzing the rat genes alone are highlighted in green. A single ω+ site identified in analysis of both the mouse and rat lineages is highlighted in blue. (G) Schematic of ω+ sites for the V1R family (posterior probability > 0.90 in one model and > 0.5 in at least one other model) highlighted in blue. The V1R proteins could not be reliably aligned to the rhodopsin sequence, and so positions of ω+ sites are relative to published predictions of secondary structures (Dulac and Axel 1995; Ryba and Tirindelli 1997). Swiss-PDBviewer (www.expasy.org/spdbv/; Guex et al. 1999) was used for all structural manipulations, and POVRAY (www.povray.org) was used to generate images.


