
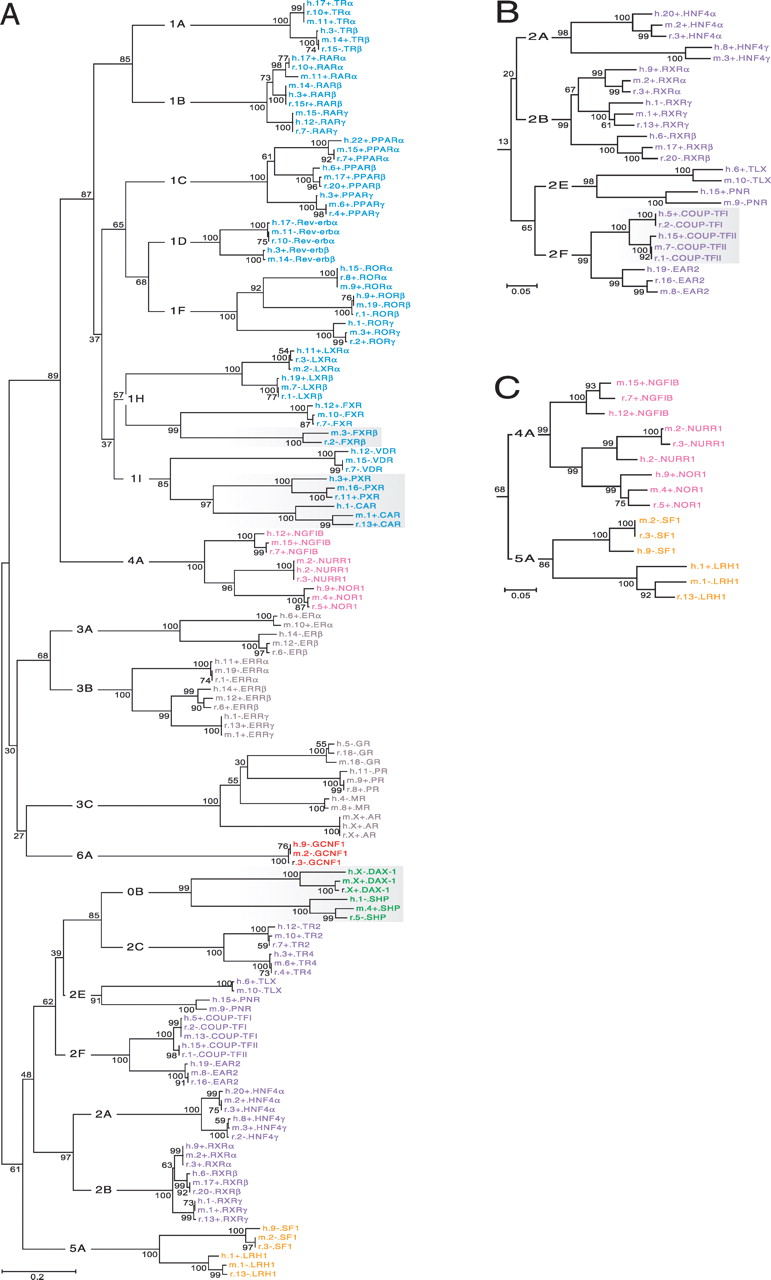
Unrooted phylogenetic trees of the NR family. The same color scheme for NR subfamilies is used as in Fig. 1. Group-level designations (e.g., 0B, 1A, 1B,..., 6A) label the interior branches, but common gene names label the terminal branches. Bootstrap values expressed in percentage are indicated at the nodes (branch bifurcations). (A) A complete tree constructed from the multiple sequence alignment of the LBDs of all NRs found in rat, mouse, and human. Shading highlights groups exhibiting rapid evolution. (B) NR2 subfamily clade (orphan receptors) taken from the DBD tree. Shading highlights a group exhibiting increased conservation. (C) Portion of DBD tree showing the relationship between subfamilies NR4 and NR5.


