
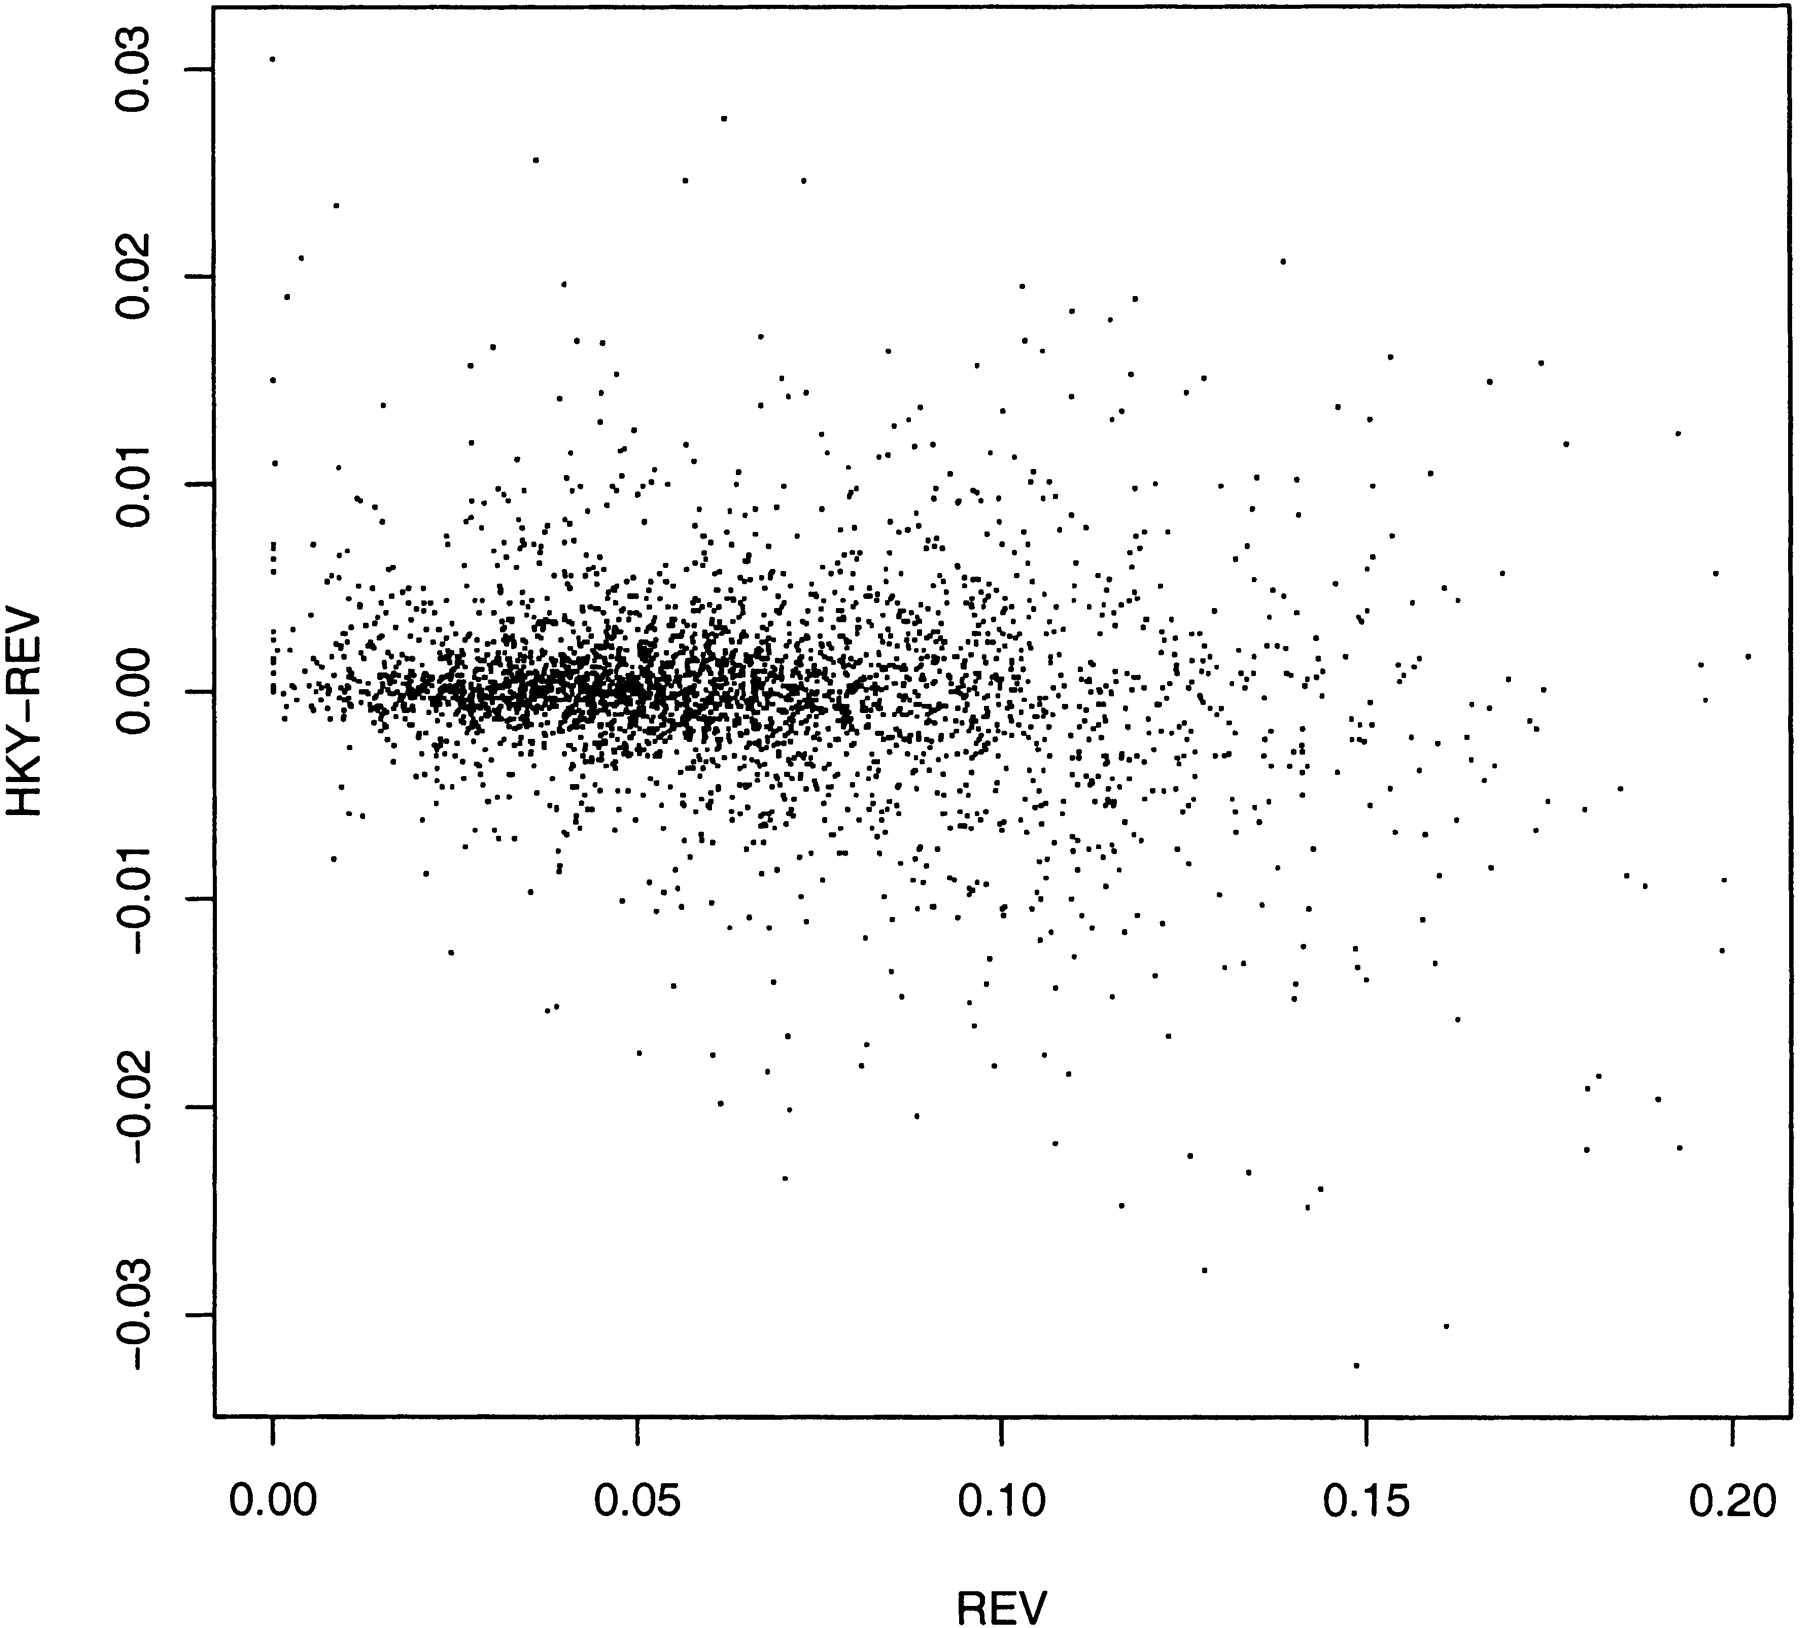
Figure 2
Plot of the difference of estimated rat branch length by the HKY and the REV against the REV branch length for the conserved regions. To present the data clearly, every 200-th block was actually plotted, yielding 3234 points. The correlation coefficient for the plot is –0.17, and for the 646,741 conserved regions is –0.18. The corresponding plot for mouse is very similar.


