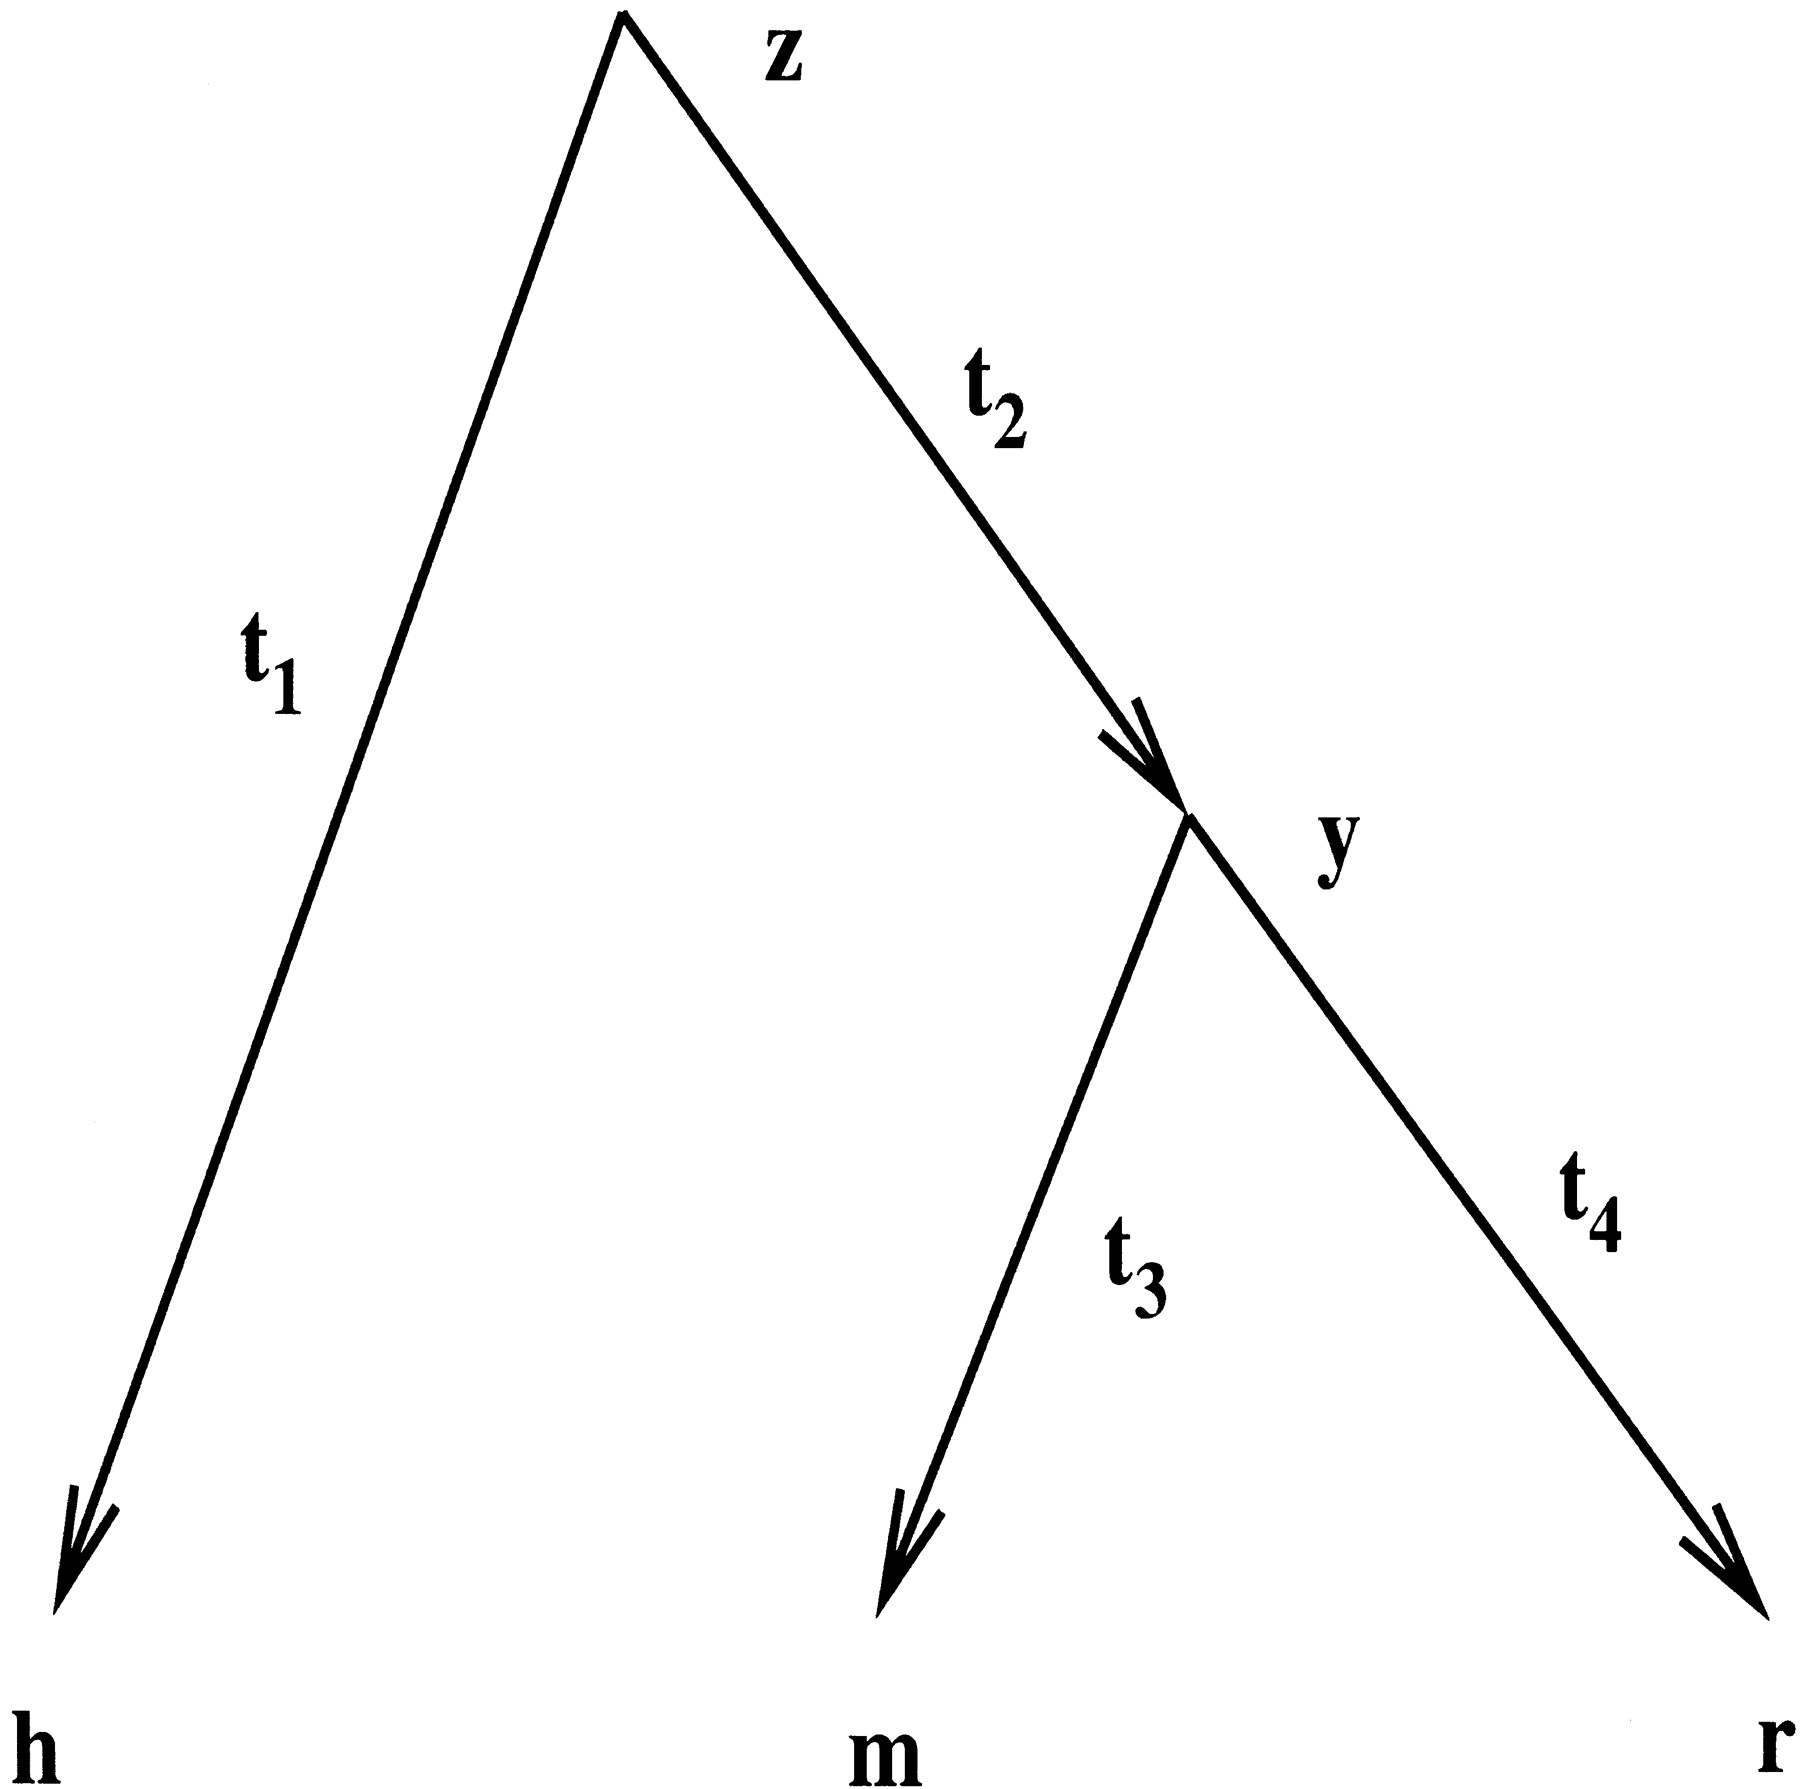
Identification of Evolutionary Hotspots in the Rodent Genomes

(Downloading may take up to 30 seconds. If the slide opens in your browser, select File -> Save As to save it.)

Click on image to view larger version.

Figure 1
Figure 1

The evolutionary tree relating h, m, r, the most recent rodent ancestor y, and the most recent common ancestor z. By pooling ancient repeat sites, the branch lengths are th = t1 + t2 = 0.36, tm = t3 = 0.070 and tr = t4 = 0.073 substitutions per site.

This Article

  1. Genome Res. 14: 574-579

Preprint Server