
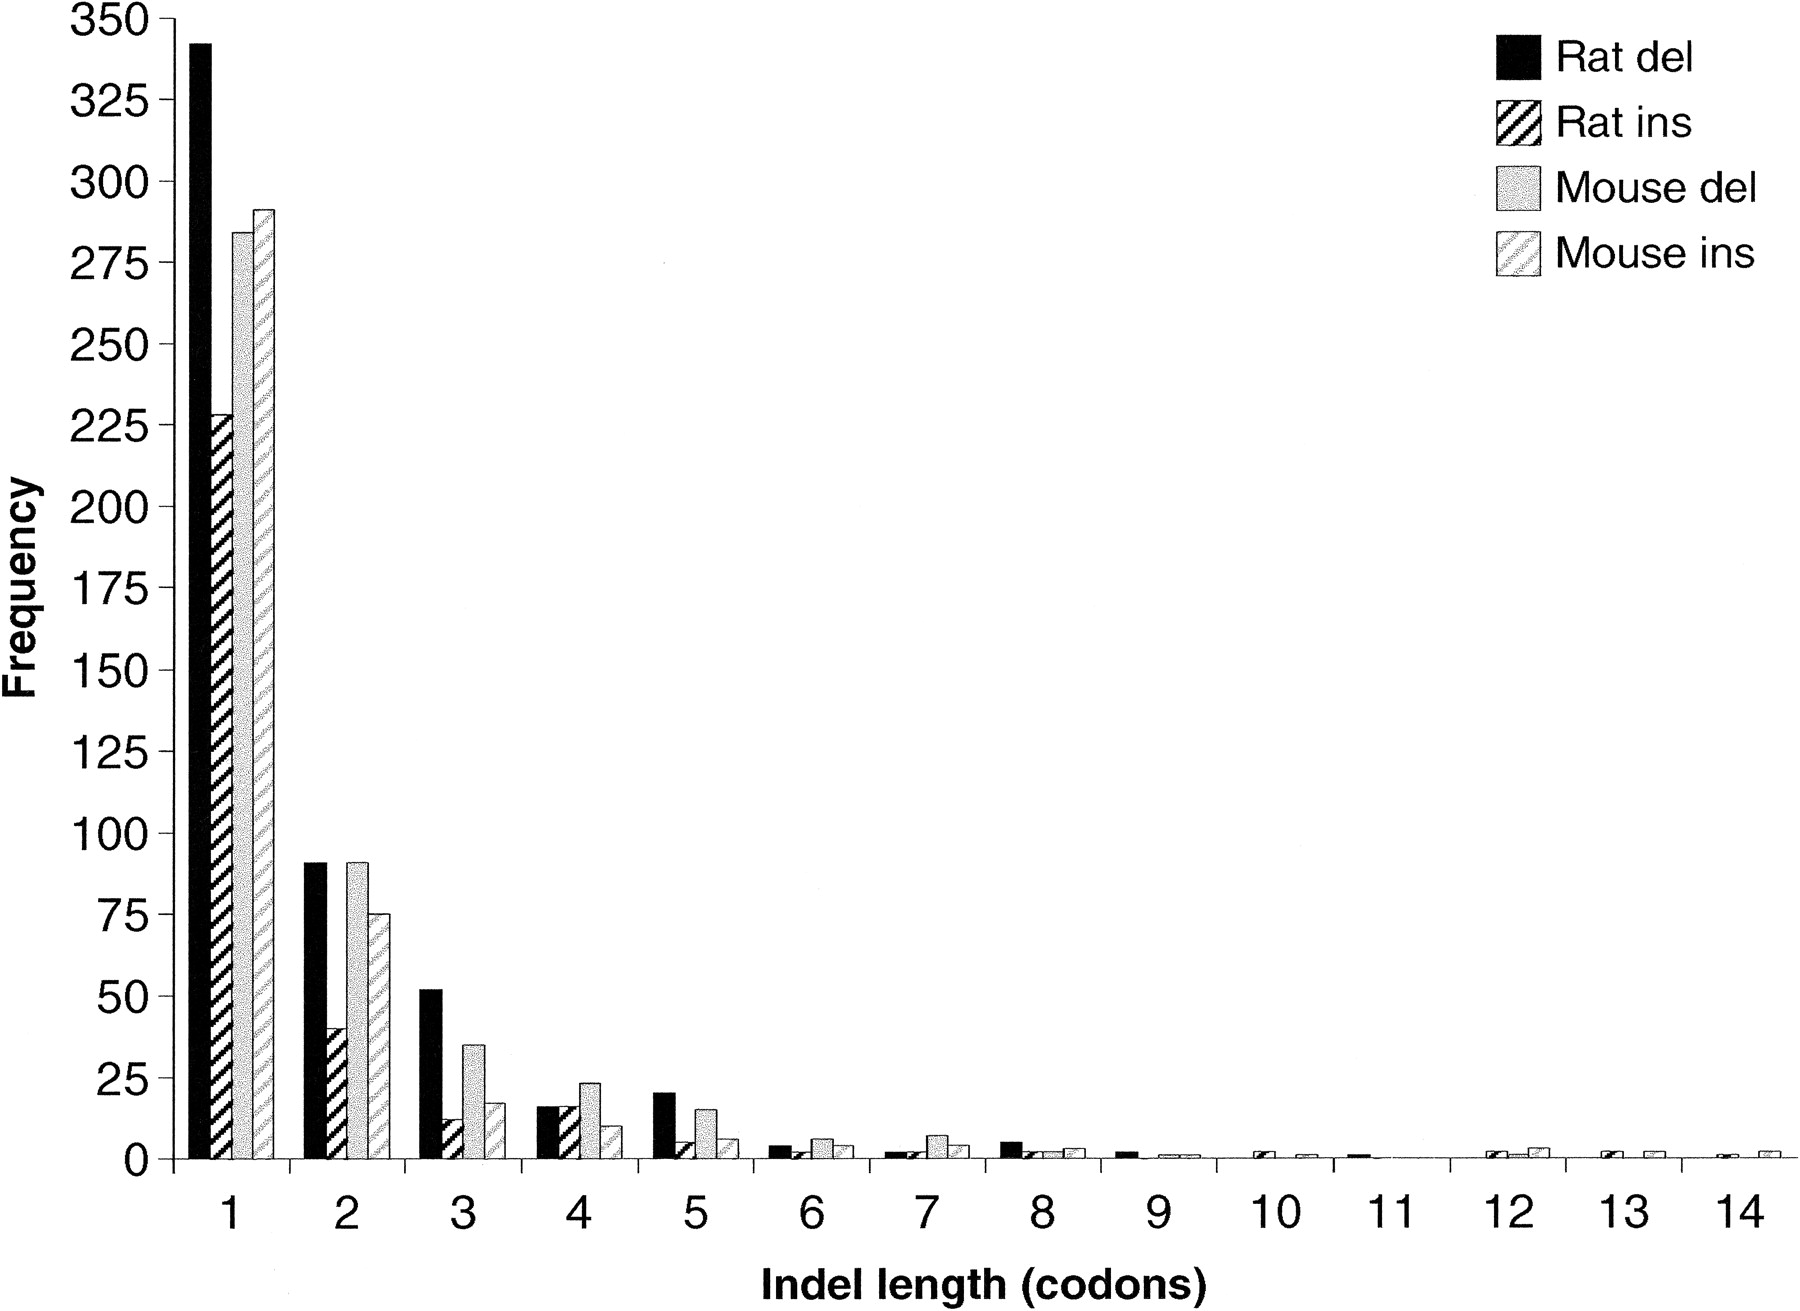
Figure 2
Frequency distribution of insertion and deletion event lengths. The X-axis shows categories of event length and the Y-axis frequency counts (raw counts) for observed indel events from each event length, type, and species category. The X-axis is truncated at 14 codons for clarity; indels were observed up to 28 codons in length. See Table 1 for the significance estimates of differences evident in the graph.


