

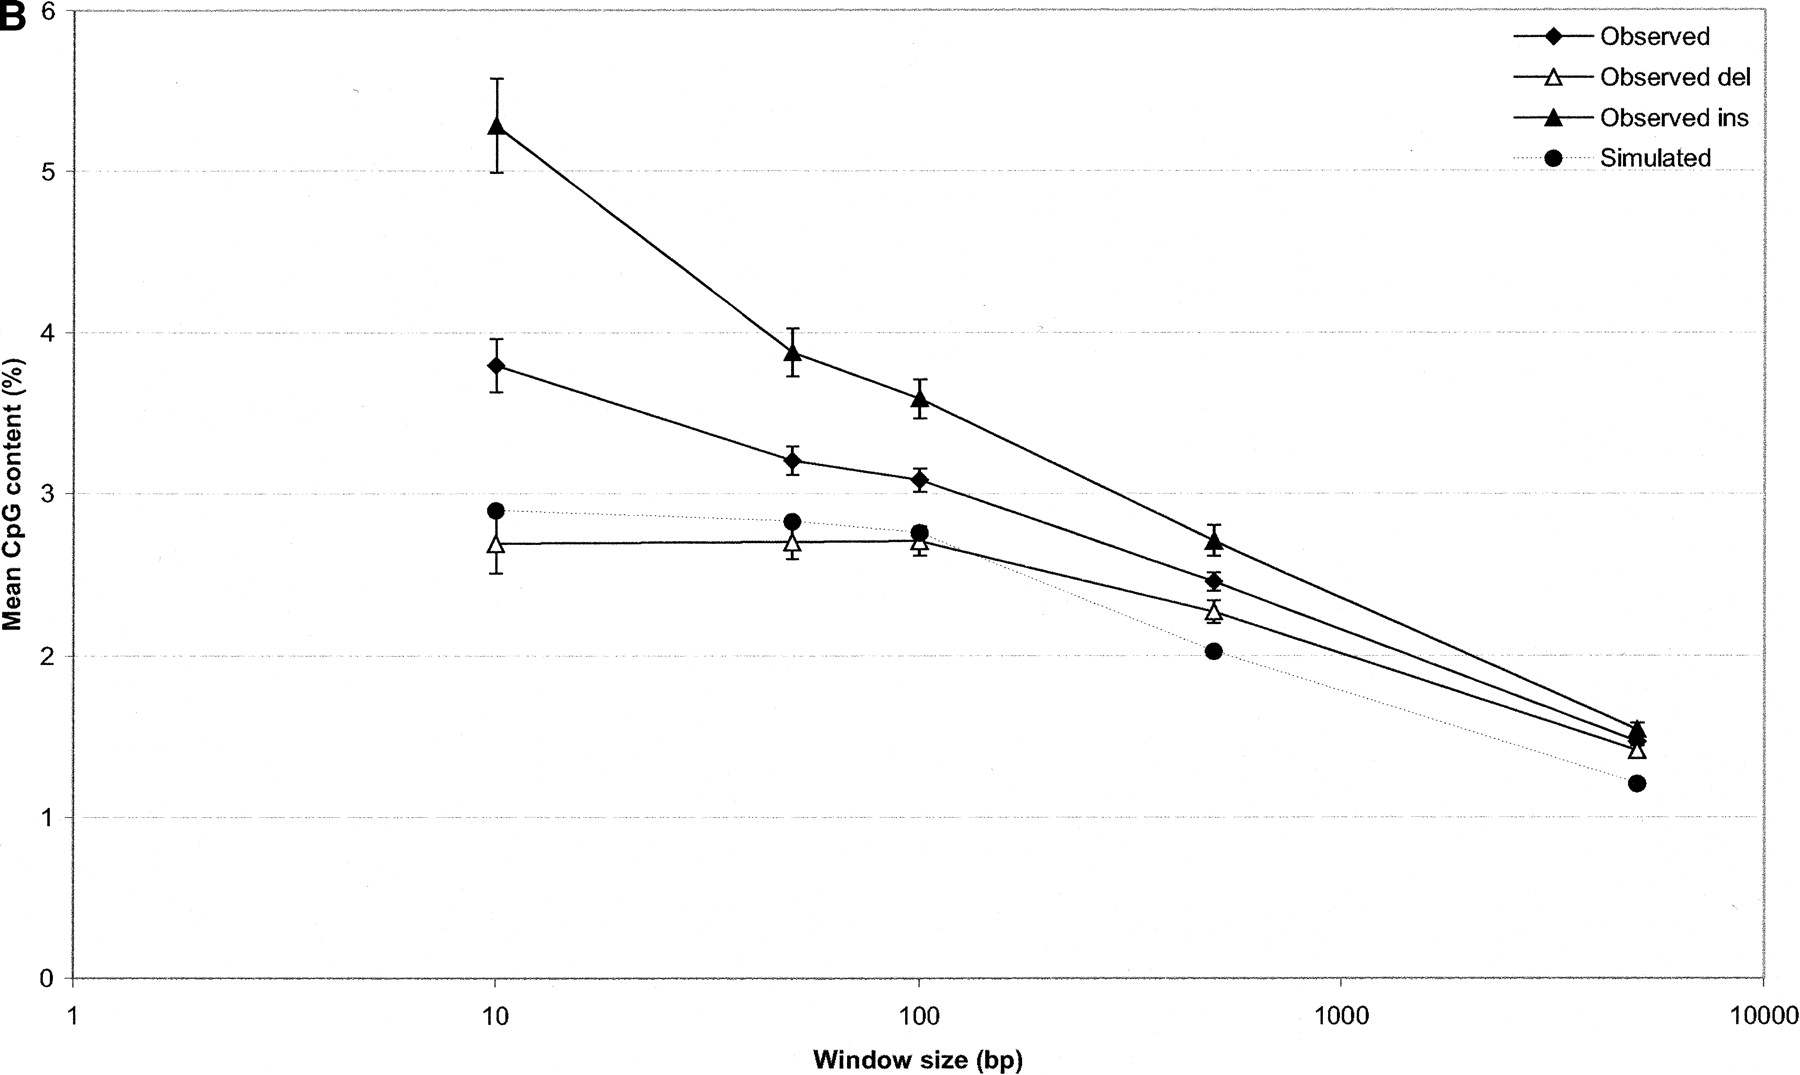
The G+C and CpG context of indel events. G+C nucleotide and CpG dinucleotide content was measured in nucleotide windows of 10, 50, 100, 500, and 5000 nt centered around indel events (measurements taken from the event sequence). Ten simulated data sets were used to calculate background levels of nucleotide and dinucleotide frequency. In both charts, error bars indicate standard error of the mean (SEM). Although SEM is plotted for all data points, the bars are too small to resolve on some data points. (A) Average G+C percent (Y-axis) plotted against window sizes used to measure local sequence composition (X-axis, log scale). (B) Average CpG dinucleotide count as a percentage of dinucleotides within window sizes used to measure local sequence composition (X-axis, log scale).


