
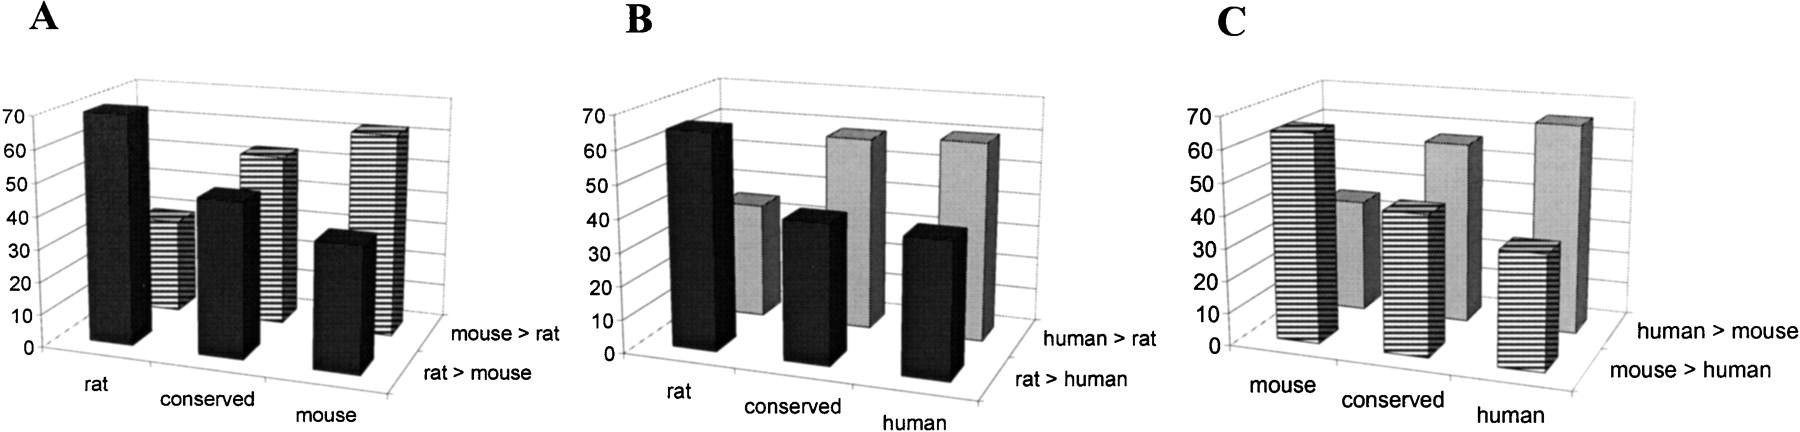
Comparison of coding GC content ratio content between orthologous coding sequences encoding amino acid repeats. (A) Rat–mouse comparison, (B) rat–human comparison, (C) mouse–human comparison. In the calculation of the GC content, all regions encoding repeats were eliminated. Two types of data sets were used: (1) only one species ortholog contained repeat/s (e.g., “rat” in A corresponds to rat–mouse orthologous pairs in which only the rat gene encodes amino acid repeats), and (2) both orthologs encoded at least one repeat in an equivalent position (conserved). In each data set, the fraction of pairs in which GC content ratio was superior in one of the two species (e.g., mouse > rat) was calculated. The number of sequence pairs ranged from 65 in C (mouse) to 721 in A (conserved).


