
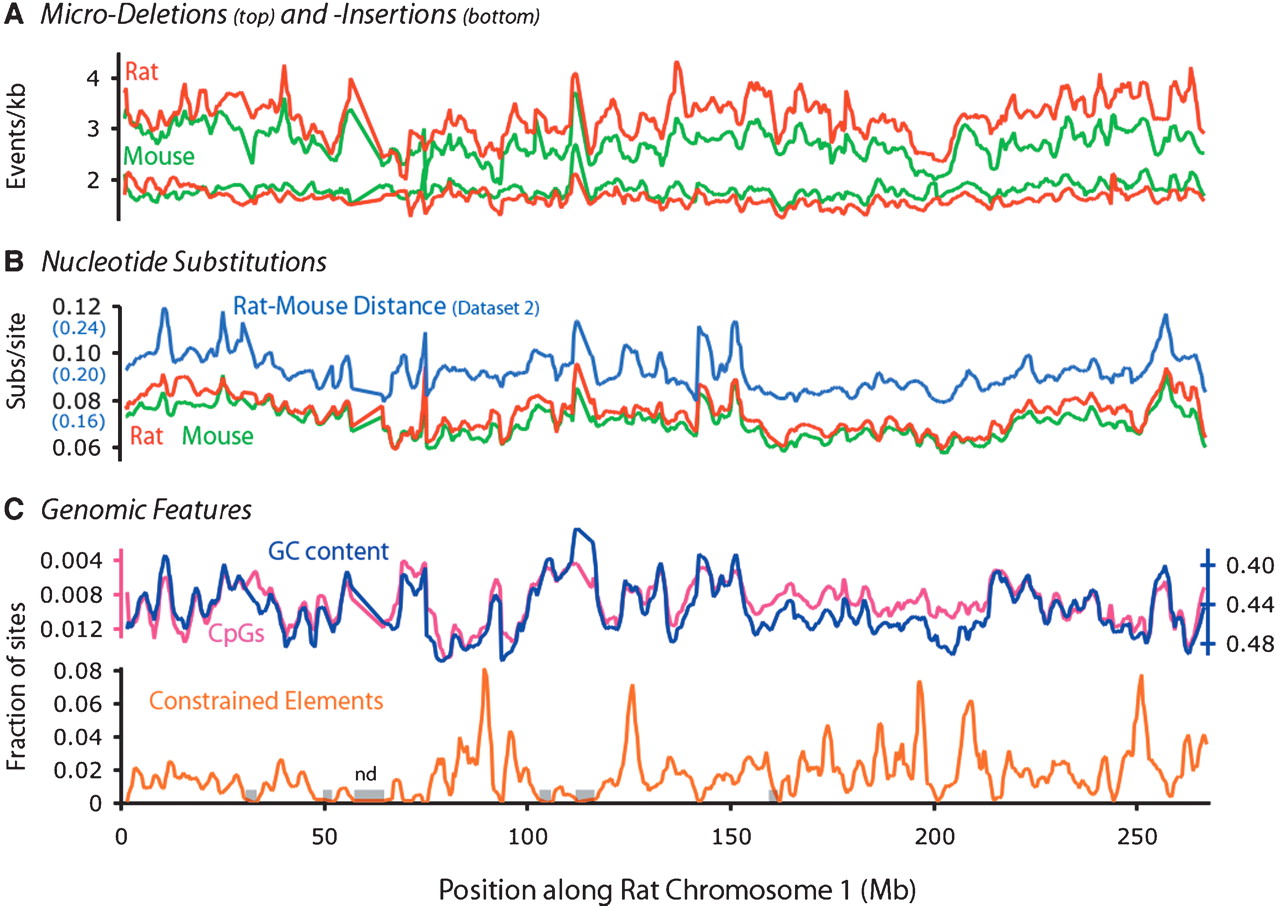
Variation of various evolutionary and genomic features along rat Chromosome 1. The X-axis for all plots is the genomic coordinates along rat chromosome 1 (draft v 3.1), in megabases. Regions in which no alignment data were available (applies to all plots) are marked as gray boxes (“nd”) directly on the X-axis. (A) Rates of microinsertion (top) and microdeletion (bottom), with mouse and rat in green and red, respectively. Note the correlations among all four lines, and especially between lineages (red vs. green). (B) Rates of nucleotide substitution for the rat and mouse lineages (red and green lines, respectively). The pairwise distance between mouse and rat as estimated from rodent-specific sites is in blue. Note the correlation between the red/green and blue lines, which originate from Datasets 1 and 2, respectively. (C) GC content and CpG density are in blue and pink, respectively. Y-axes, which are inverted to show the correlation with the rate of neutral point substitution, are colored accordingly. The density of constrained elements evolving at <20% of the local neutral rate is shown in orange, and shows no significant covariation with any of the other features analyzed.


