
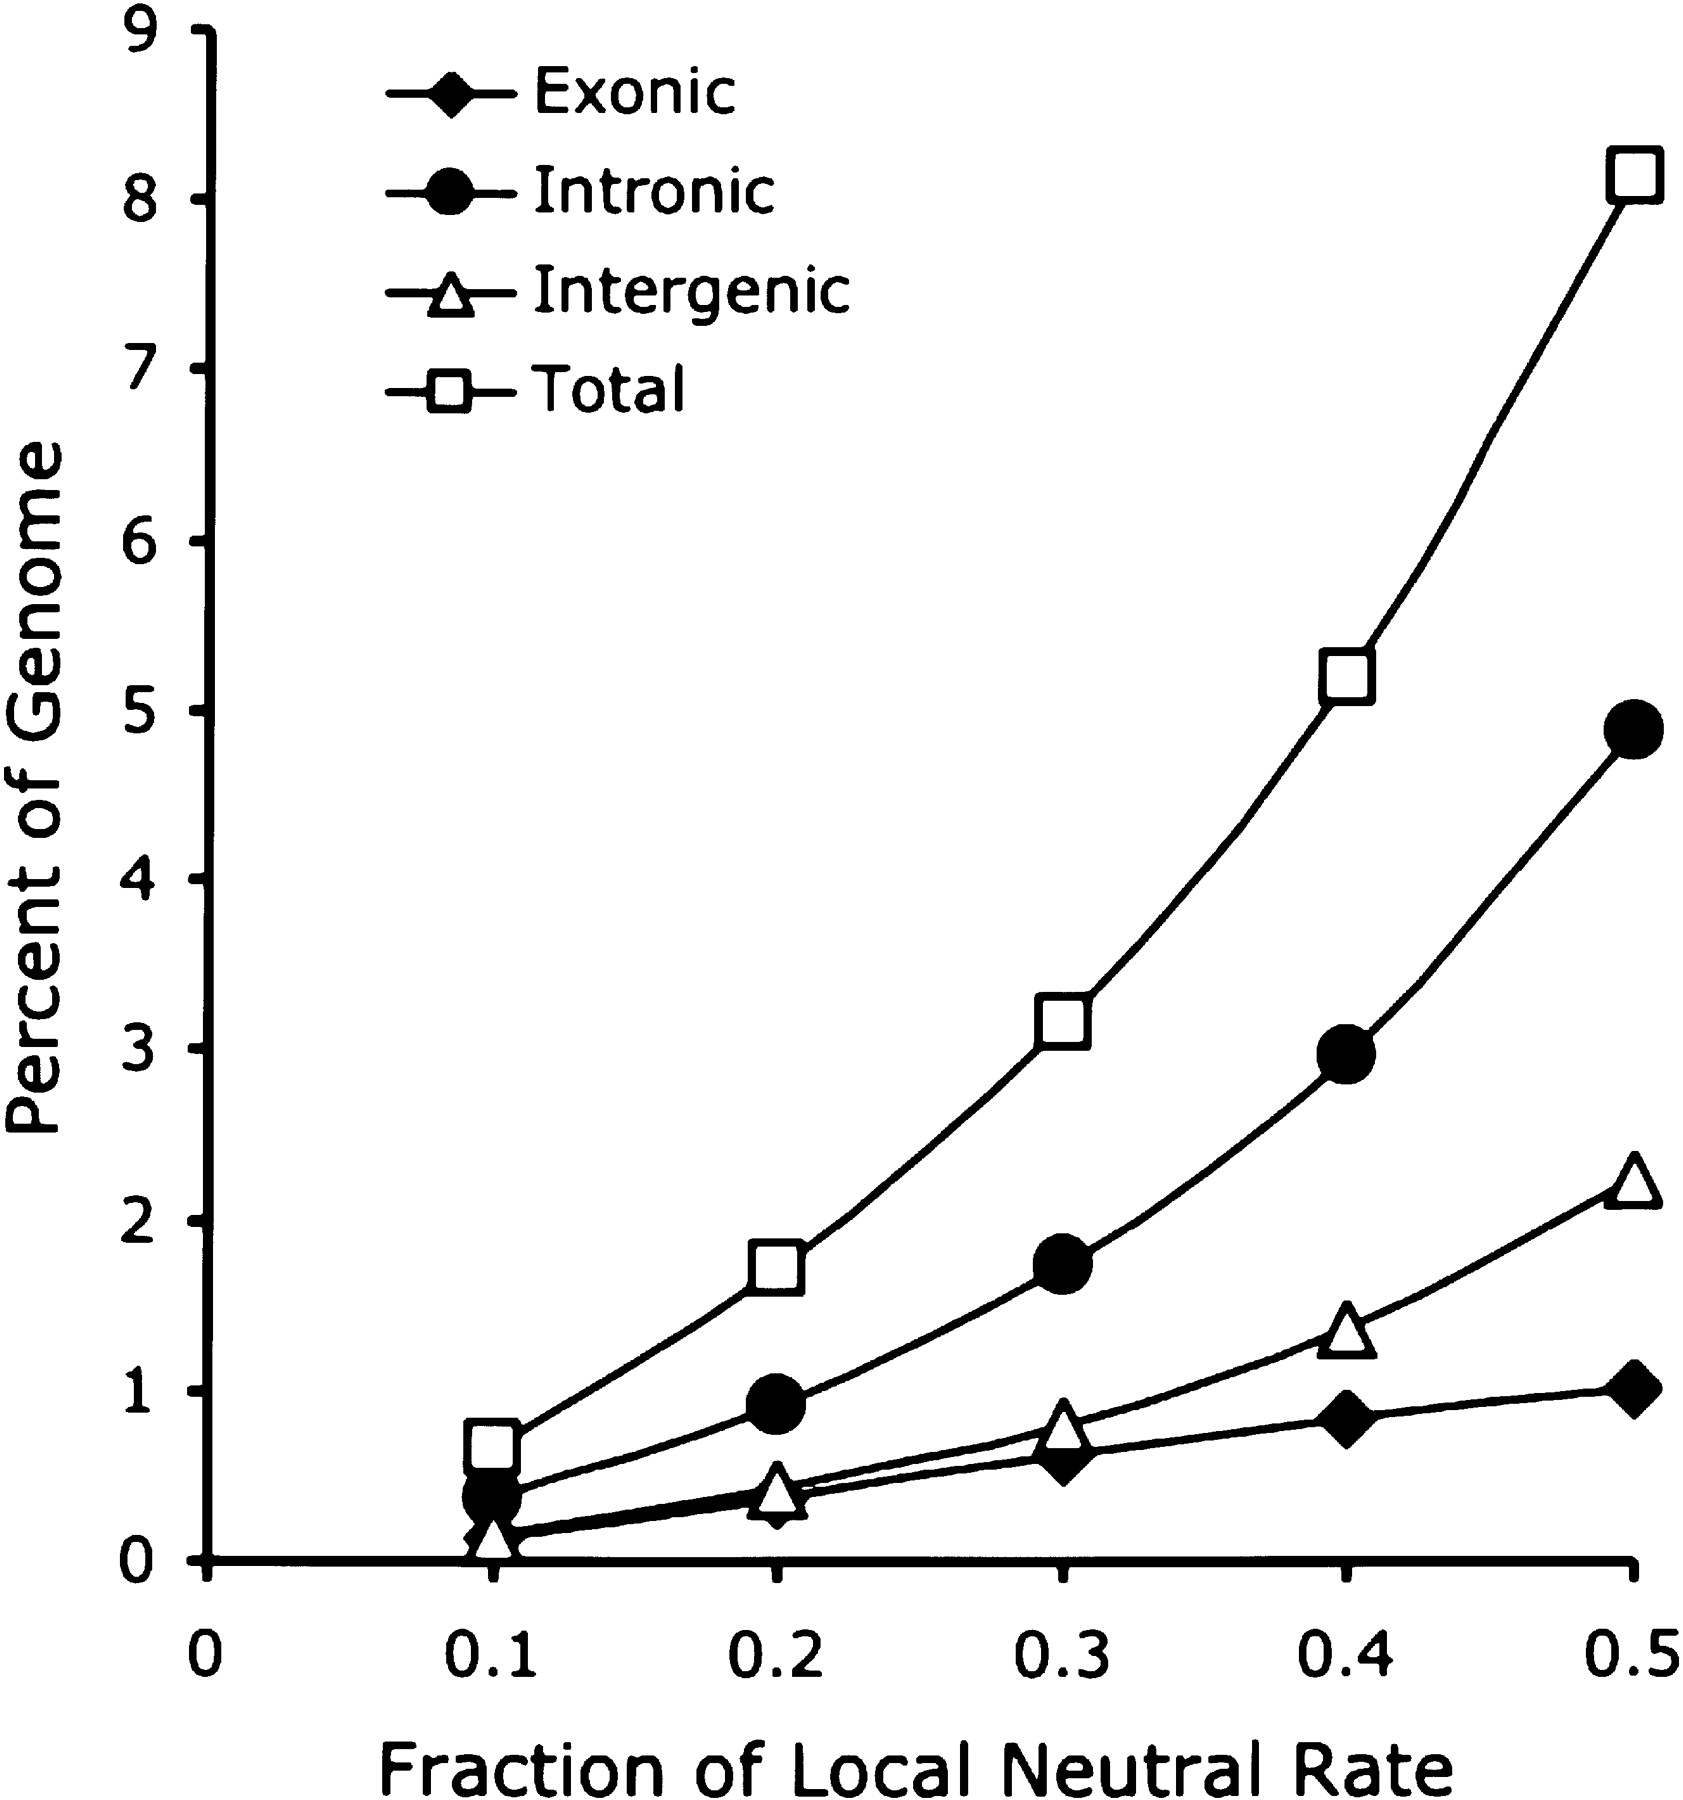
Figure 5
Density of constrained elements in the human genome. The fraction of the human genome annotated by our analysis as evolving at various fractions of the neutral rate, from 0.1–0.5. Total density of constrained elements are plotted (squares), in addition to being classified by type: intronic (circles), intergenic (triangles), and exonic (diamonds), based on gene annotations that include RefSeq and predicted genes.


