
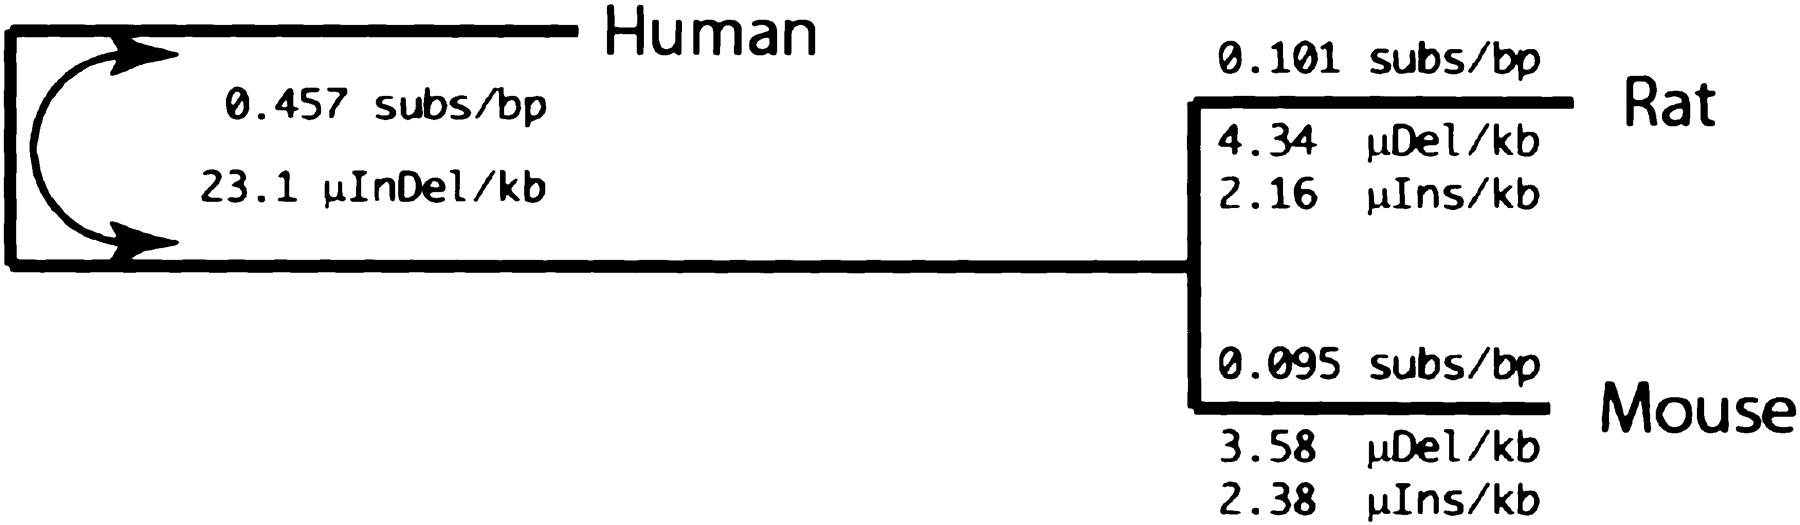
Figure 3
Tree of human, mouse, and rat, drawn to the scale of point substitutions estimated from Dataset 1 (Fig. 1). Tree is rooted for display purposes, but analyses were performed assuming an unrooted tree (note the arrow connecting the ancestral rodent and human branches). Each branch is annotated with the neutral substitution rate, as estimated using rodent-specific sites. For the mouse and rat branches, rates of small insertion and deletion are also shown, whereas for the human/ancestral rodent branch, the sum of small insertions and deletions is shown.


