
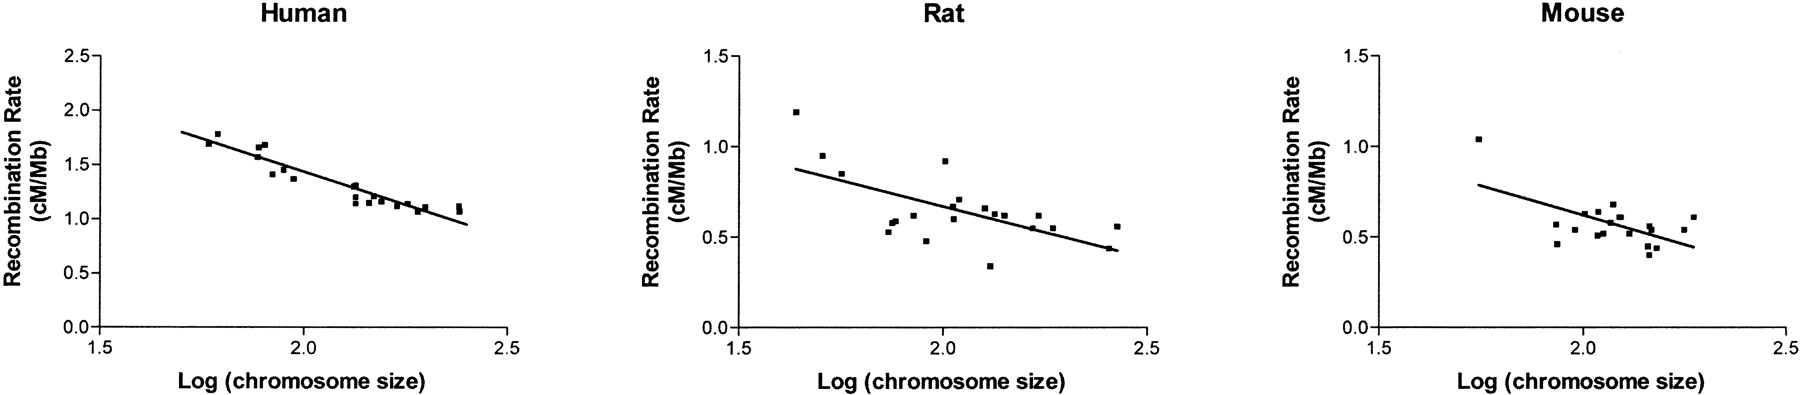
Figure 2
Chromosomal recombination rate as a function of chromosome size. The regression slope is no longer significantly different than zero in mouse if the smallest chromosome (chr. 19) is removed. Similarly, in rat the regression is not significant if the three smallest chromosomes are removed. Note that the y-axis of the human graph is scaled differently than for the rodents.


