
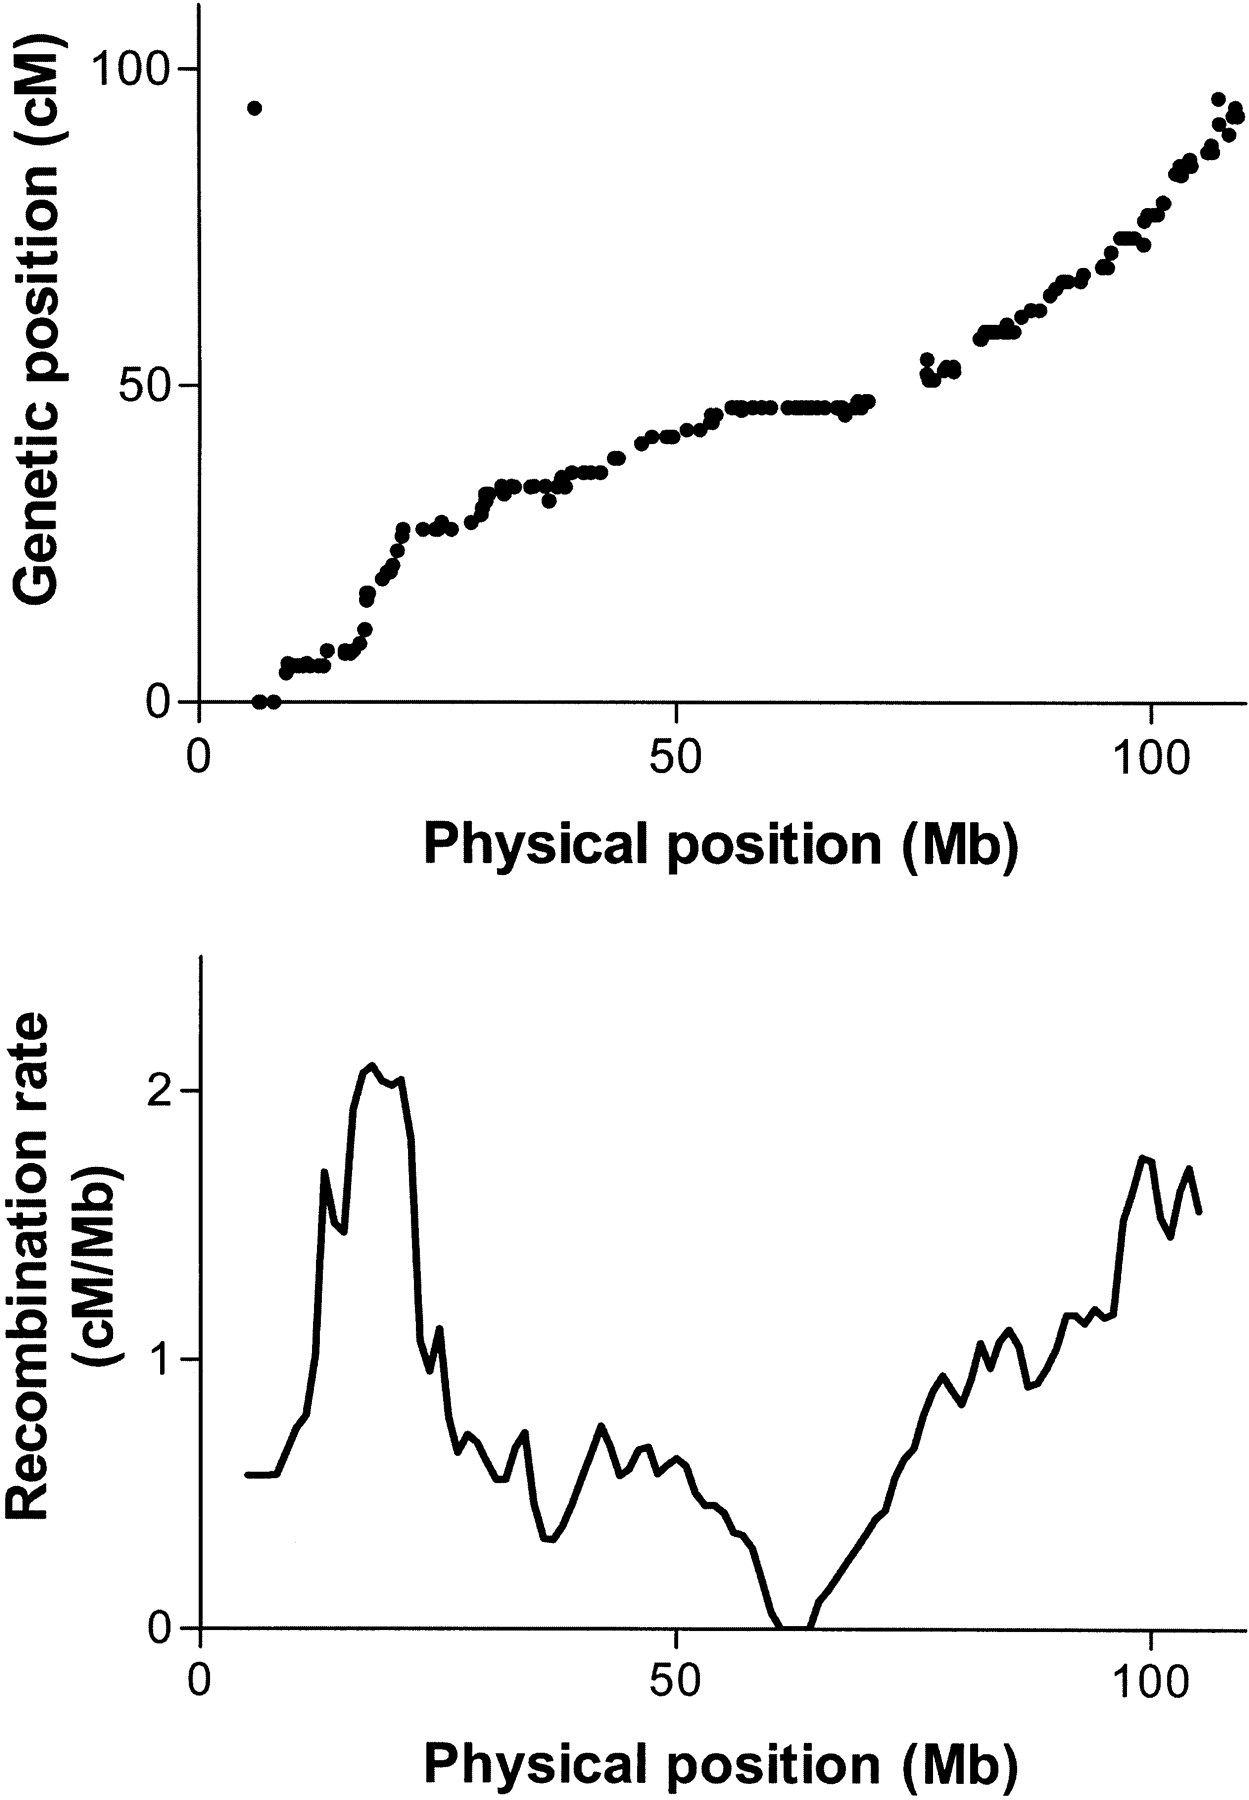
Figure 1
Plots of genetic position vs. physical position for all markers placed on the telocentric rat chromosome 10 (top), and recombination rate vs. physical position for rat chromosome 10 (bottom) after removing inconsistently placed markers. Similar plots for all chromosomes in all species are available as Supplemental Figures A–I.


