
Figure 7
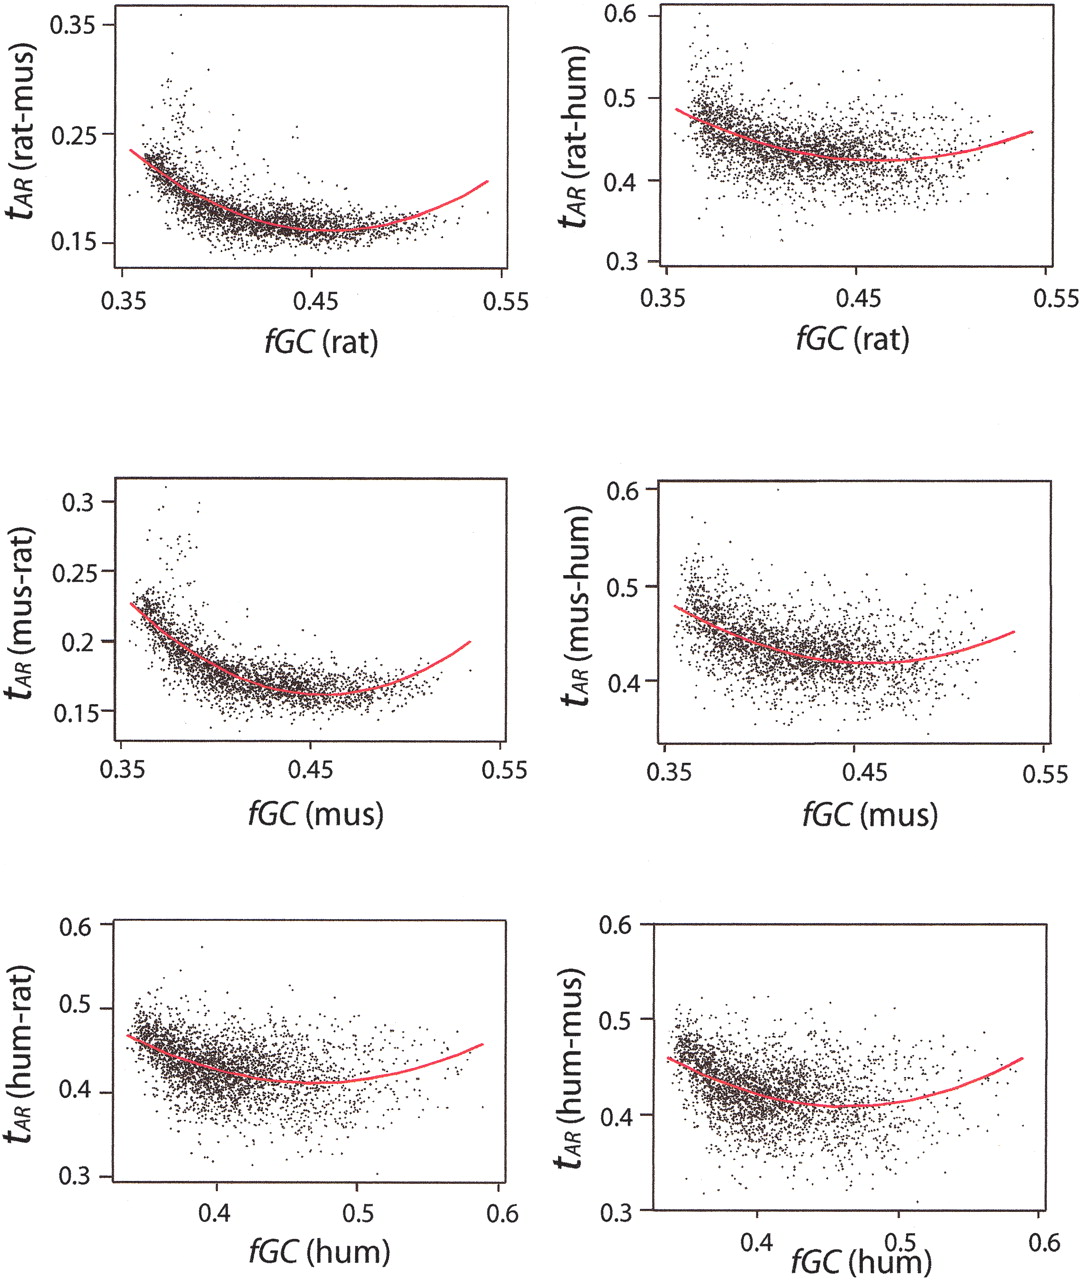
Scatter plots of tAR against GC content of the window (fGC) in alignments among rat, mouse, and human for 1-Mb nonoverlapping windows. A quadratic fit (red curve) is superimposed on each plot.
(Downloading may take up to 30 seconds. If the slide opens in your browser, select File -> Save As to save it.)
Click on image to view larger version.
Scatter plots of tAR against GC content of the window (fGC) in alignments among rat, mouse, and human for 1-Mb nonoverlapping windows. A quadratic fit (red curve) is superimposed on each plot.
 CiteULike
 Delicious
 Digg
Digg Facebook
 Google+
 Reddit
 Twitter
