
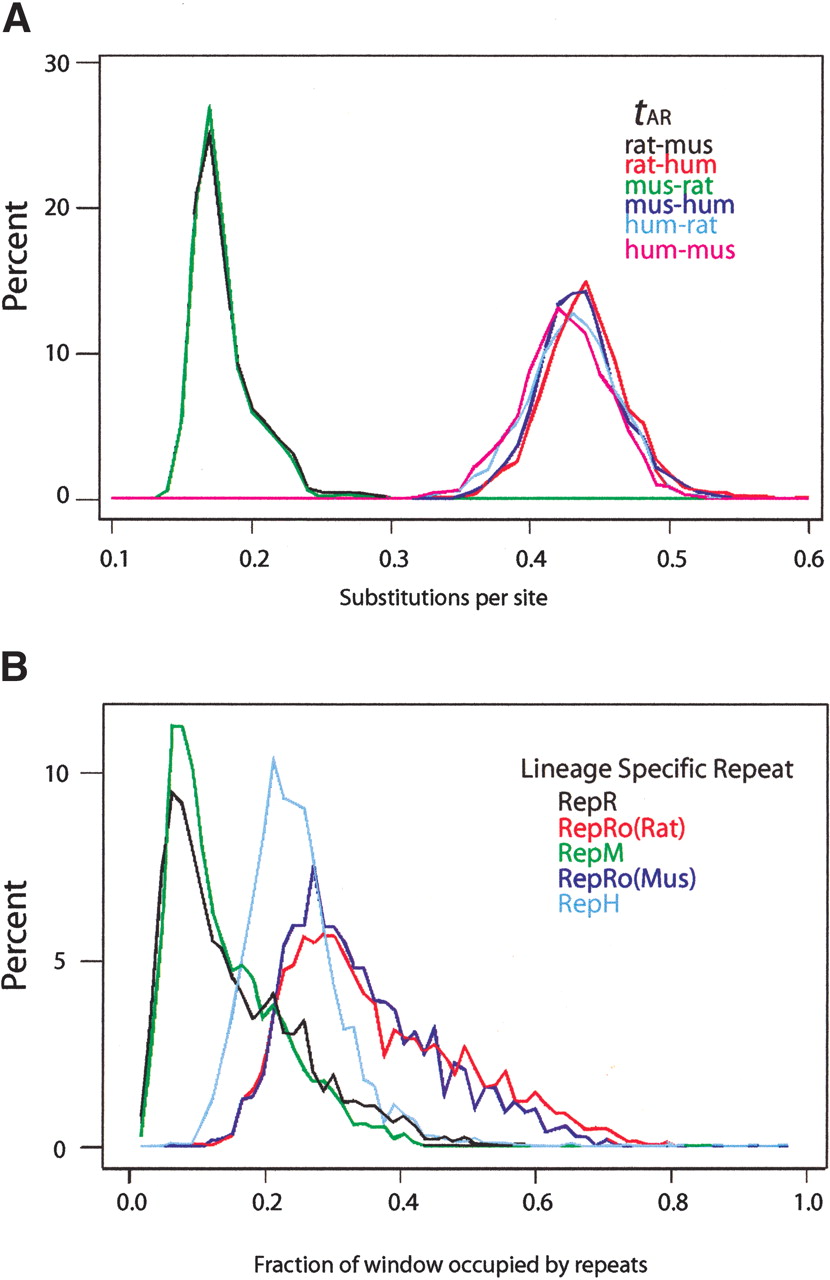
Distributions of divergence rates for pairwise comparisons among rat, mouse, and human. (A) Histograms of tAR, the local nucleotide substitution rate in aligned ancestral repeats, for alignments between rat and mouse (black line), mouse and rat (green line), rat and human (red line), mouse and human alignments (dark blue line), human and rat (light blue line), and human and mouse (violet line). (B) Histograms of the density of lineage-specific interspersed repeats on the rat branch (RepR, black line), the mouse branch (RepM, green line), the human branch (RepH, light blue line), and the rodent branch (RepRo). The latter was computed in the rat genome to determine RepRo(Rat), the red line, and in the mouse genome to determine RepRo(Mus), the dark blue line. All measures were computed in 1-Mb nonoverlapping windows.


