
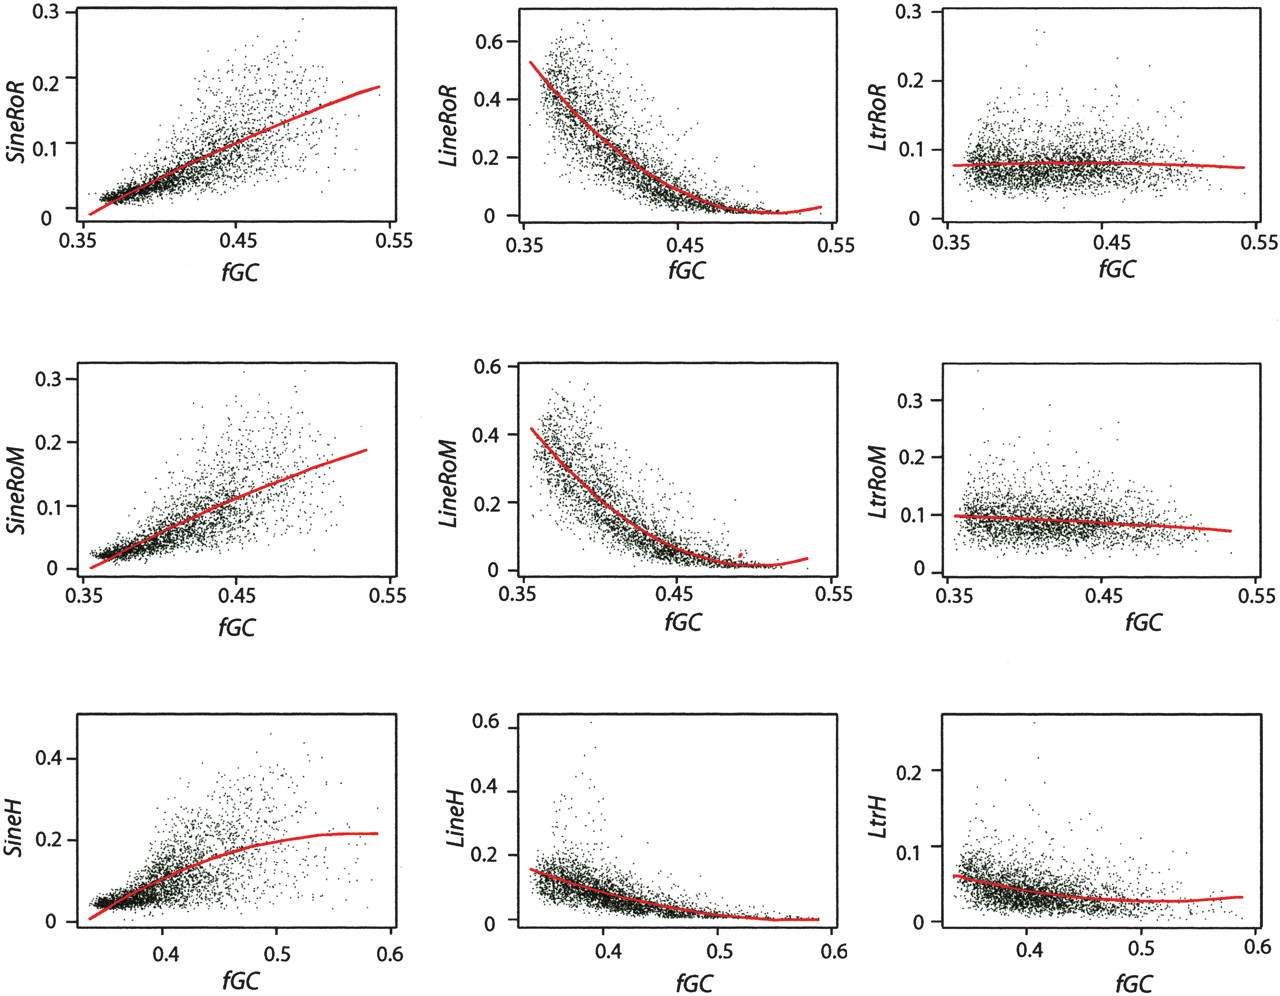
Figure 4
Scatter plots of lineage-specific repeat densities in 1-Mb nonoverlapping windows by family (SINEs, LINEs, and LTRs) against GC content of the window in rat, mouse, and human. The fraction of nucleotides in the 1-Mb window occupied by each family of lineage-specific repeat is the density plotted on the y-axis; the fraction of nucleotides in the window that are G or C is the fraction GC (fGC) plotted on the x-axis. For mouse and rat, the lineage-specific repeats are those that accumulated on both the rodent and mouse (suffix RoM) or rodent and rat (suffix RoR) branches. A quadratic fit (red curve) is superimposed on each plot.


