
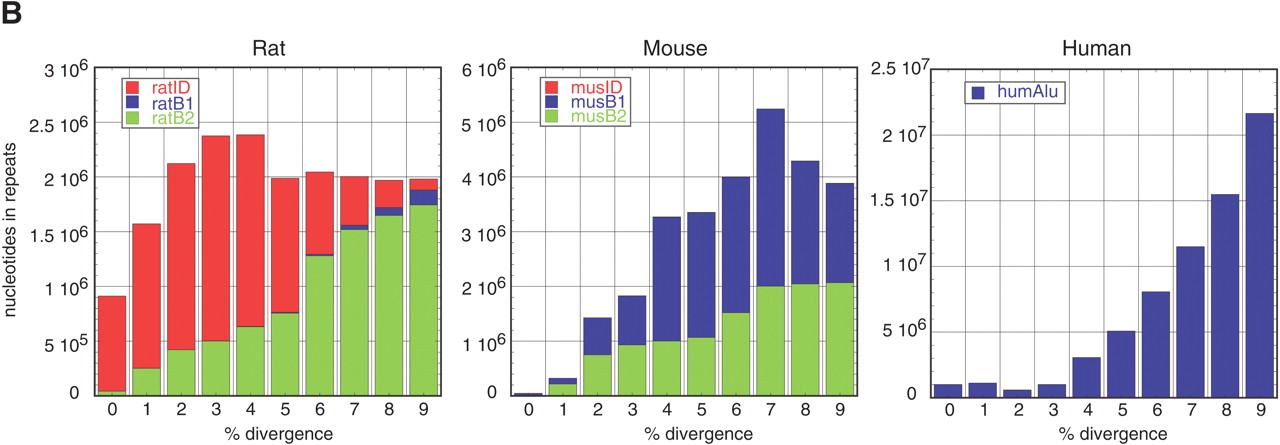
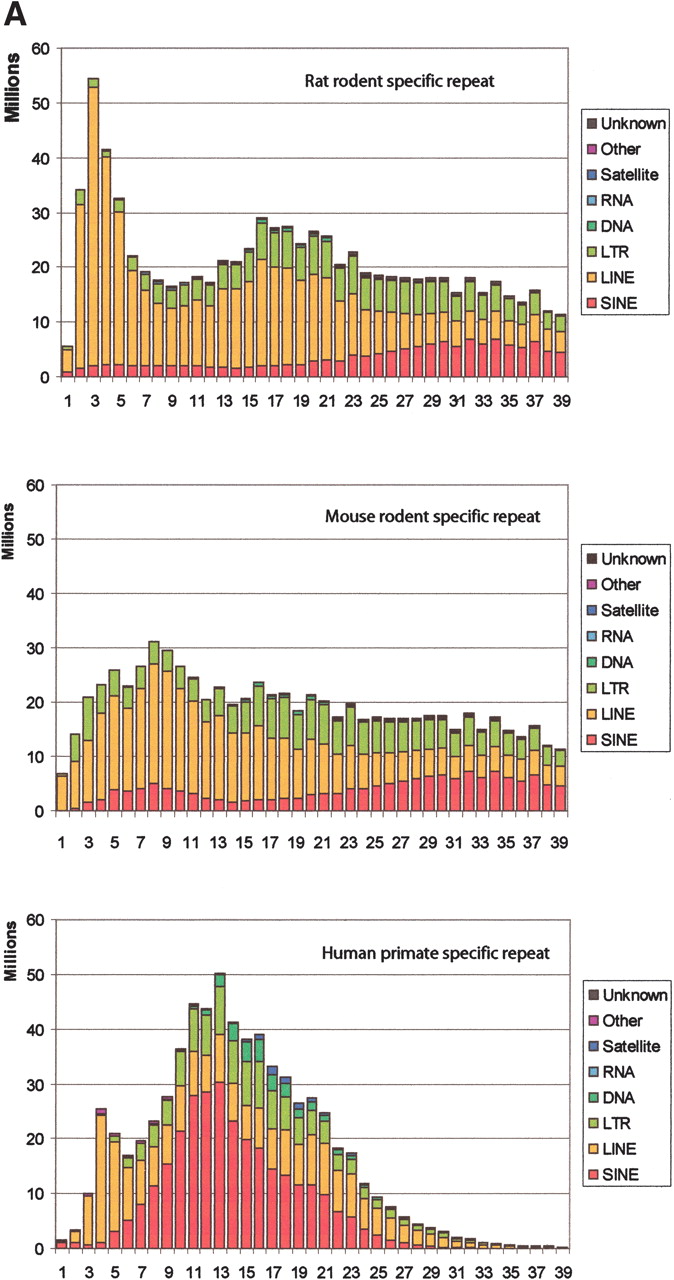
Age distribution of repeats in rat, mouse, and human that have inserted since their divergence from AHMR. The x-axis represents divergence from consensus sequences, corrected for multiple hits at a single site using the Jukes-Cantor model (Jukes and Cantor 1969). This model was chosen for this analysis to be consistent with previous publications (International Human Genome Sequencing Consortium 2001; Mouse Genome Sequencing Consortium 2002). The y-axis is the number of nucleotides occupied by each repeat family at each divergence level. (A) Distribution for all repeat families that have accumulated since the divergence from AHMR. For rat, the repeats are those that accumulated along both the rodent and the rat branches (Fig. 1); for mouse, the repeats are those that accumulated along both the rodent and the mouse branches (Fig. 1); for human, the repeats are those that accumulated along the human branch (Fig. 1). (B) Distribution of recent mammalian SINEs by age and family. The number of nucleotides in each family is plotted by percent divergence from the consensus sequence for each family. Only recent SINEs (0%–9% divergence) are examined in rat (left), mouse (middle), and human (right). The rat recent SINEs consist of IDs (red), B1s (blue), and B2s (green). The recent SINEs in mouse consist of B1s (blue) and B2s (green); the mouse IDs are not visible on the plot. Recent SINEs in humans are exclusively Alu repeats (blue).


