
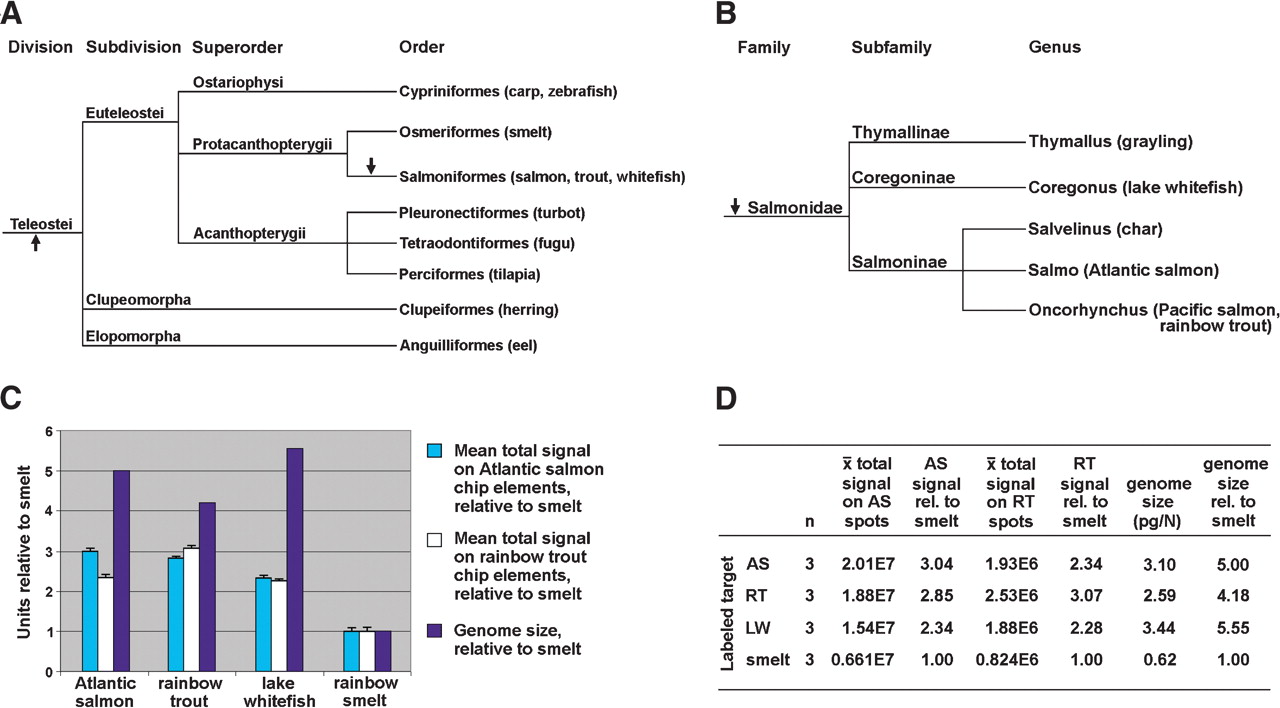
Evolutionary relationships, genome sizes, and microarray hybridization characteristics of three salmonids relative to smelt. (A) Phylogenetic tree, based on morphological characters, showing evolutionary relationships among teleosts relevant to this study, and other fish orders with genome projects (Nelson 1994). (B) Phylogenetic tree, based on morphological characters, showing evolutionary relationships of select salmonids (Smith and Stearley 1989; Kido et al. 1991). Arrows indicate putative genome duplication events (Wolfe 2001). (C, D) Mean total signals on Atlantic salmon (AS) or rainbow trout (RT) chip elements/spots (Table 6) are converted to “smelt units” by dividing by 0.661E7 for AS chip elements, or 0.824E6 for RT chip elements. Genome sizes for AS (Salmo salar), RT (Oncorhynchus mykiss), and smelt (Osmerus eperlanus, close relative of Osmerus mordax used in this study) were measured by DNA flow cytometry (Vinogradov 1998). Genome size of lake whitefish (LW, Coregonus clupeaformis) was measured by Feulgen densitometry (Booke 1968). Error bars (C) show mean total signal SEM values (Table 6) converted to “smelt units” as above. n indicates number of microarrays hybridized with labeled target from each species.


