
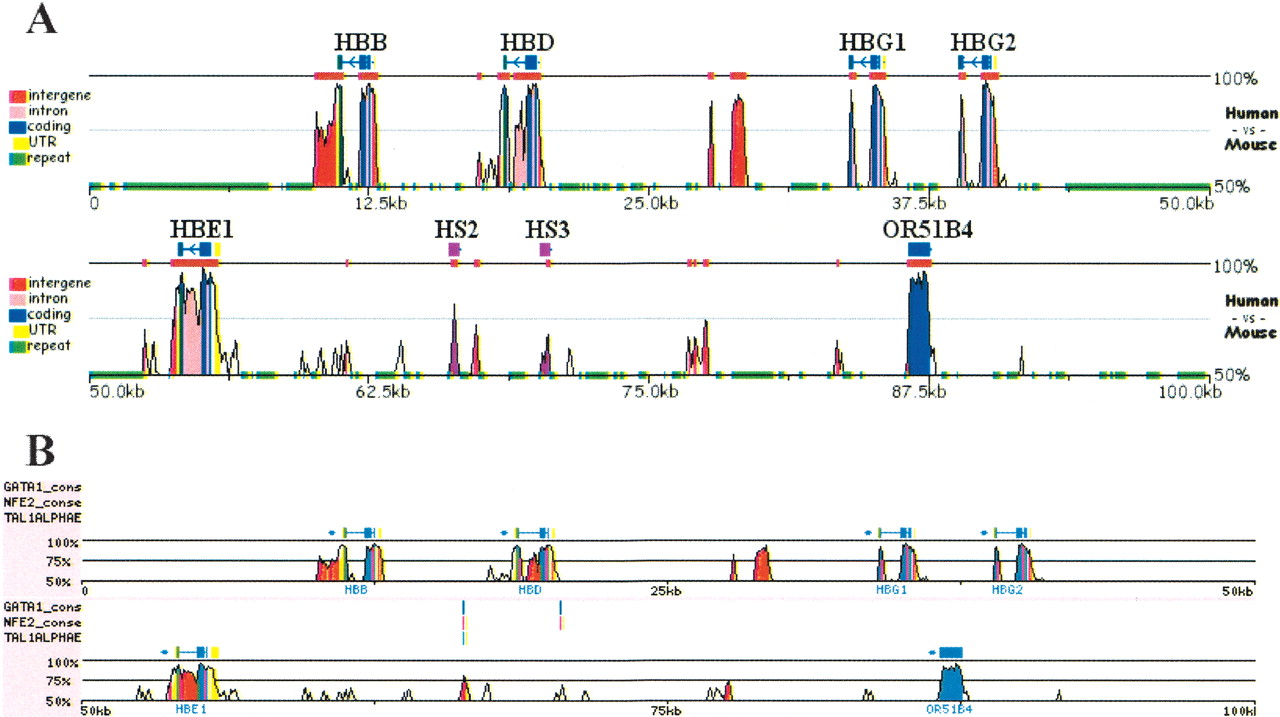
Figure 5
zPicture and rVista analysis for the HBB gene complex. Human (chr11:5199997–5300000) and mouse (chr7:92235754–92356764) genomic sequences for the HBB locus were downloaded from UCSC browser, aligned, and the conservation was analyzed (>100 bp/>70% ID) using zPicture (A). Refseq annotation was edited by providing coordinates for the functionally characterized regulatory elements, hypersensitive site 2 and 3 (purple; HS2 and HS3). Alignments were analyzed for the presence of GATA1, NFE2, and Tal1 putative transcription factor-binding sites (TFBS). Clusters of conserved TFBS (three sites/100 bp) were identified by rVista, and correspond to known regulatory elements HS2 and HS3.


