
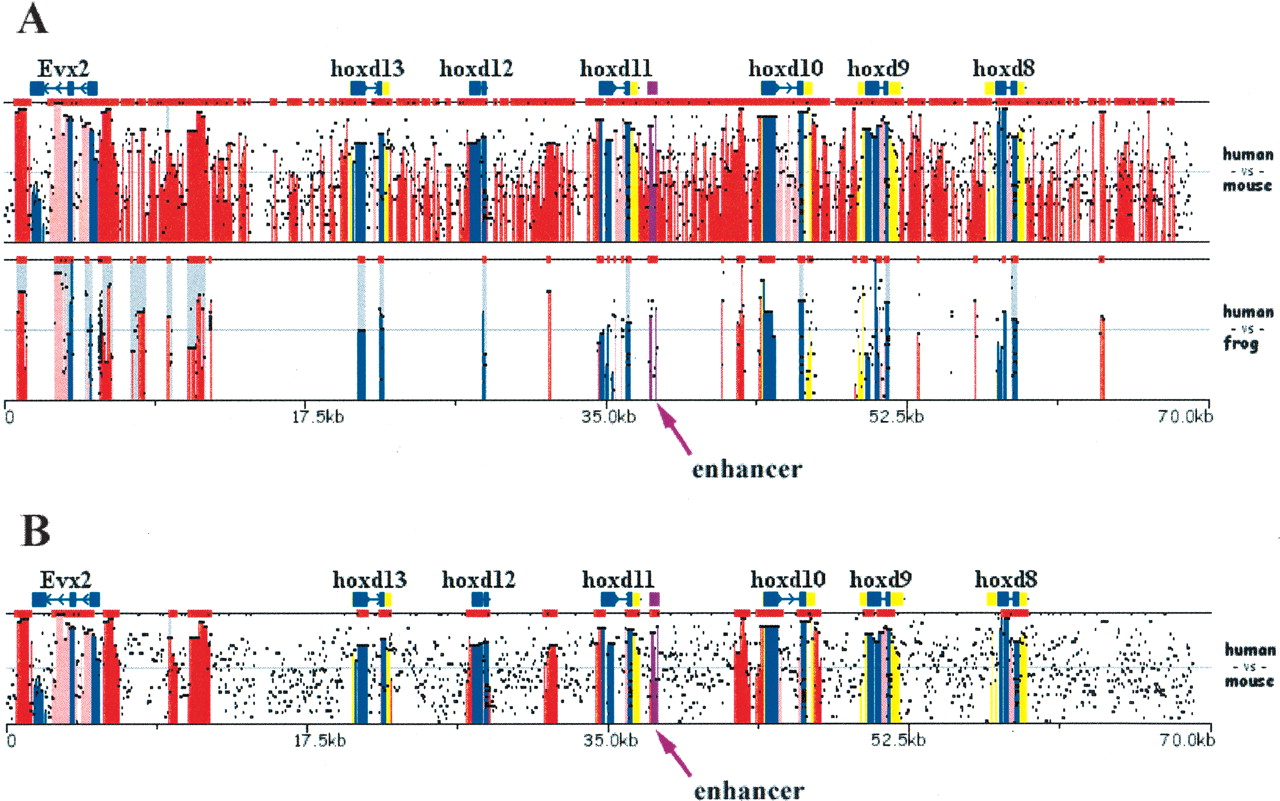
Figure 2
Dynamically modifying ECR parameters to optimize regulatory element detection. (A) Overlaid human/mouse and human/frog alignments for the HoxD cluster analyzed using default parameters (≥100 bp, ≥70%). (B) Human/mouse alignments analyzed using stringent conservation criteria (≥500 bp, ≥85%). A known enhancer was annotated as `other' feature (purple) and is pointed to by an arrow. x-axis size in kilobases; y-axis percent identity 50%–100% (A); 65%–100% (B). Frog sequence NCBI accession number AC145806.1; human and mouse sequences were downloaded from UCSC database, coordinates: human-chr2:177140000–177210000 and mouse-chr2:75814790–75951489.


