
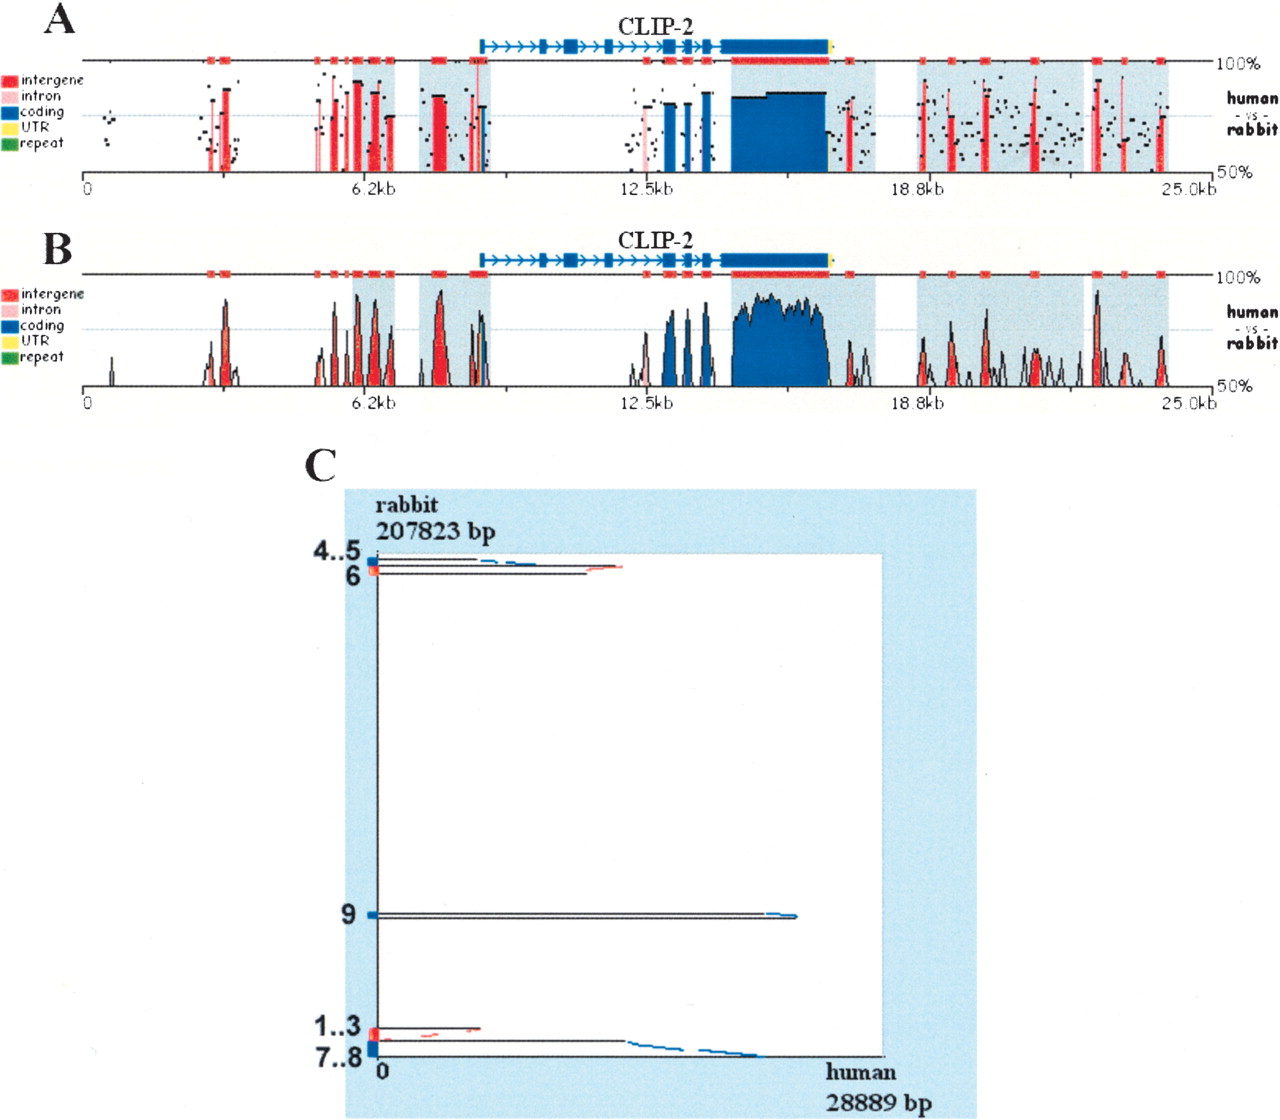
Pip (A), smooth-graph (B), and Dot-plots (C) constructed by zPicture for a 29-kb region from human chromosome 19 (chr19:19501332–19530220) and an orthologous rabbit BAC (NCBI Acc# AC145542.1). The automatic sequence upload feature extracted the human sequences and the RefSeq annotation files from the UCSC database. Default parameters (>100 bp/>70% ID) were used to highlight intronic (pink) and intragenic (red) conserved elements. Untranslated Regions (UTRs) are colored in yellow, exons are in blue and repeats are in green. Inverted regions are shaded in gray. Dot-plots (C) can be used to order and orient draft sequence contigs; positive strand alignments are in red and negative strand in blue.


