
Figure 4
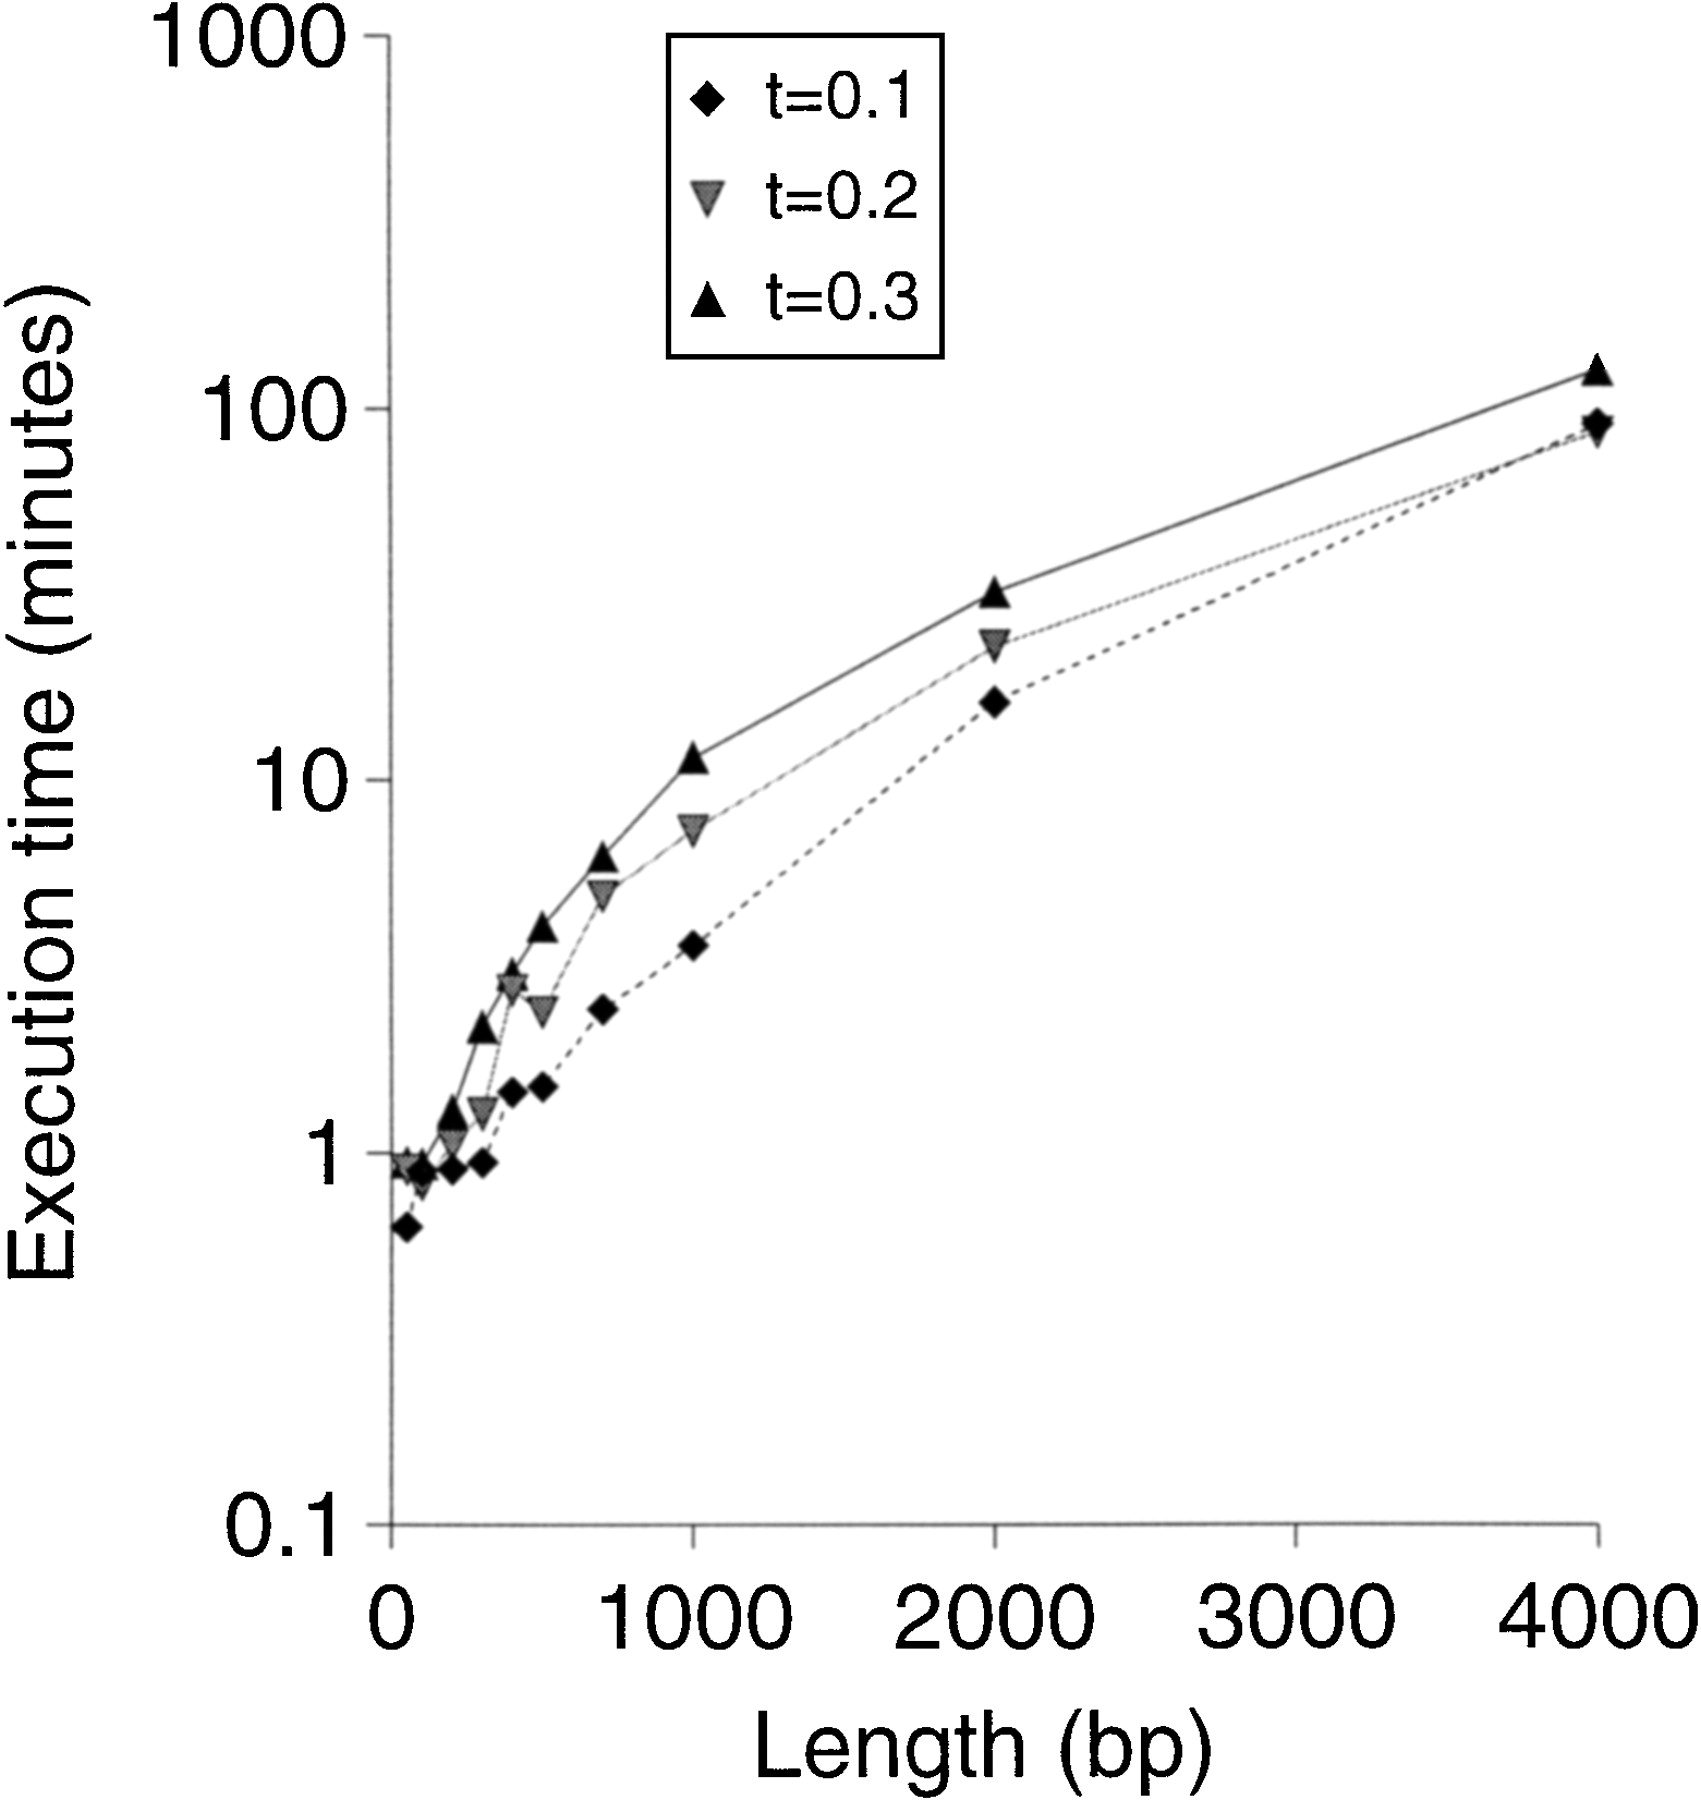
Execution time of MCALIGN plotted against sequence length for sequence divergences of 0.1, 0.2, and 0.3. Execution times were estimated from the average of five simulations.
(Downloading may take up to 30 seconds. If the slide opens in your browser, select File -> Save As to save it.)
Click on image to view larger version.
Execution time of MCALIGN plotted against sequence length for sequence divergences of 0.1, 0.2, and 0.3. Execution times were estimated from the average of five simulations.
 CiteULike
 Delicious
 Digg
Digg Facebook
 Google+
 Reddit
 Twitter
