
Figure 3
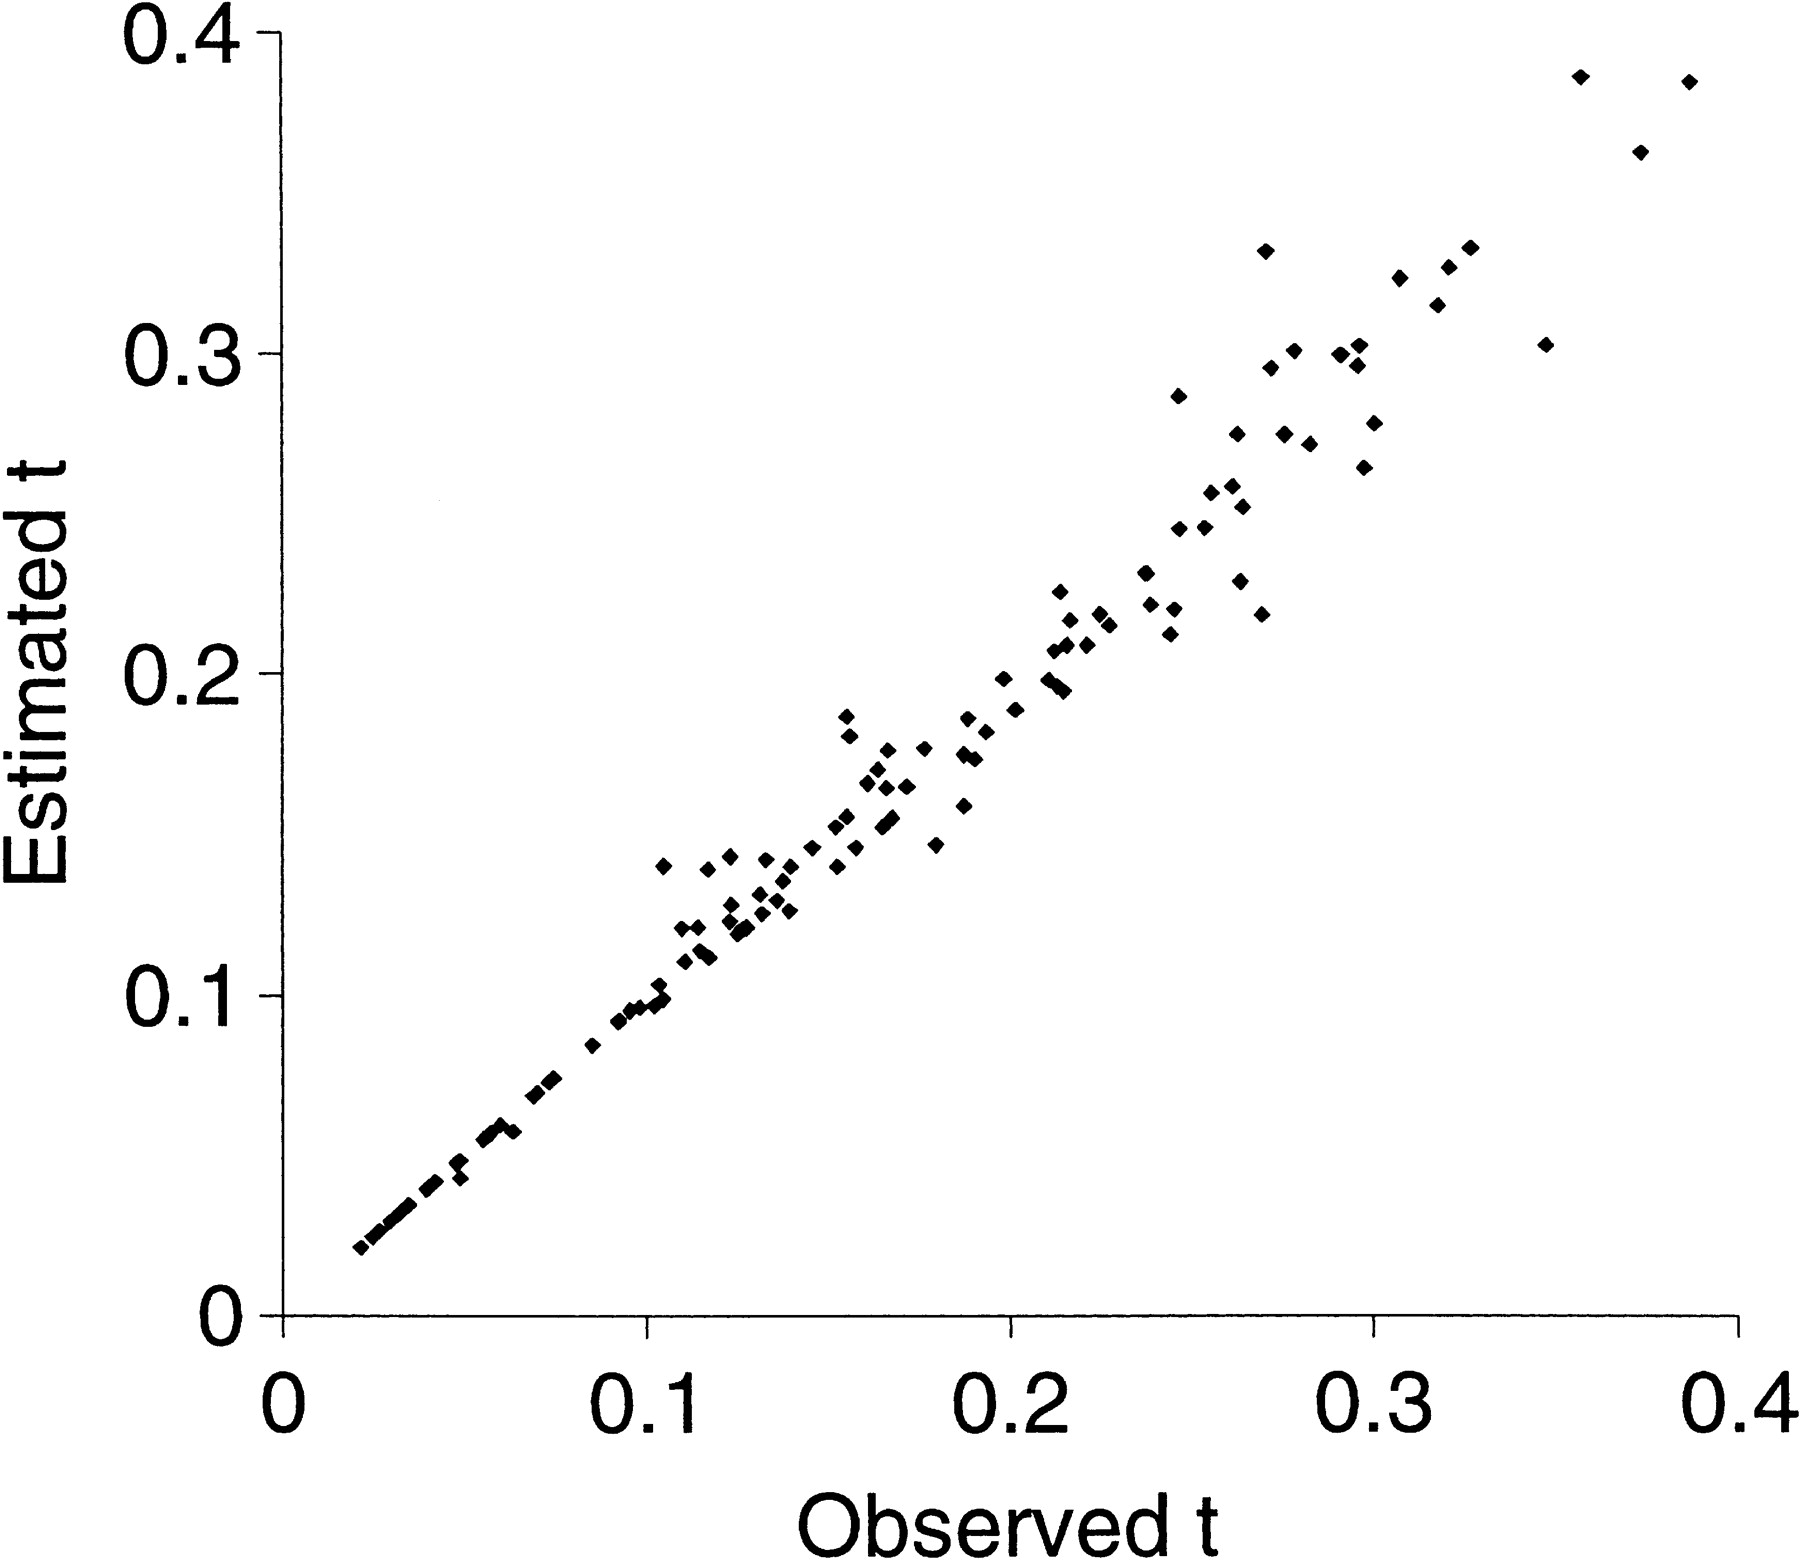
Estimated numbers of nucleotide substitutions plotted against observed numbers. Each point is the outcome from an alignment involving one simulation of sequences of length 200 bp.
(Downloading may take up to 30 seconds. If the slide opens in your browser, select File -> Save As to save it.)
Click on image to view larger version.
Estimated numbers of nucleotide substitutions plotted against observed numbers. Each point is the outcome from an alignment involving one simulation of sequences of length 200 bp.
 CiteULike
 Delicious
 Digg
Digg Facebook
 Google+
 Reddit
 Twitter
