
Figure 2
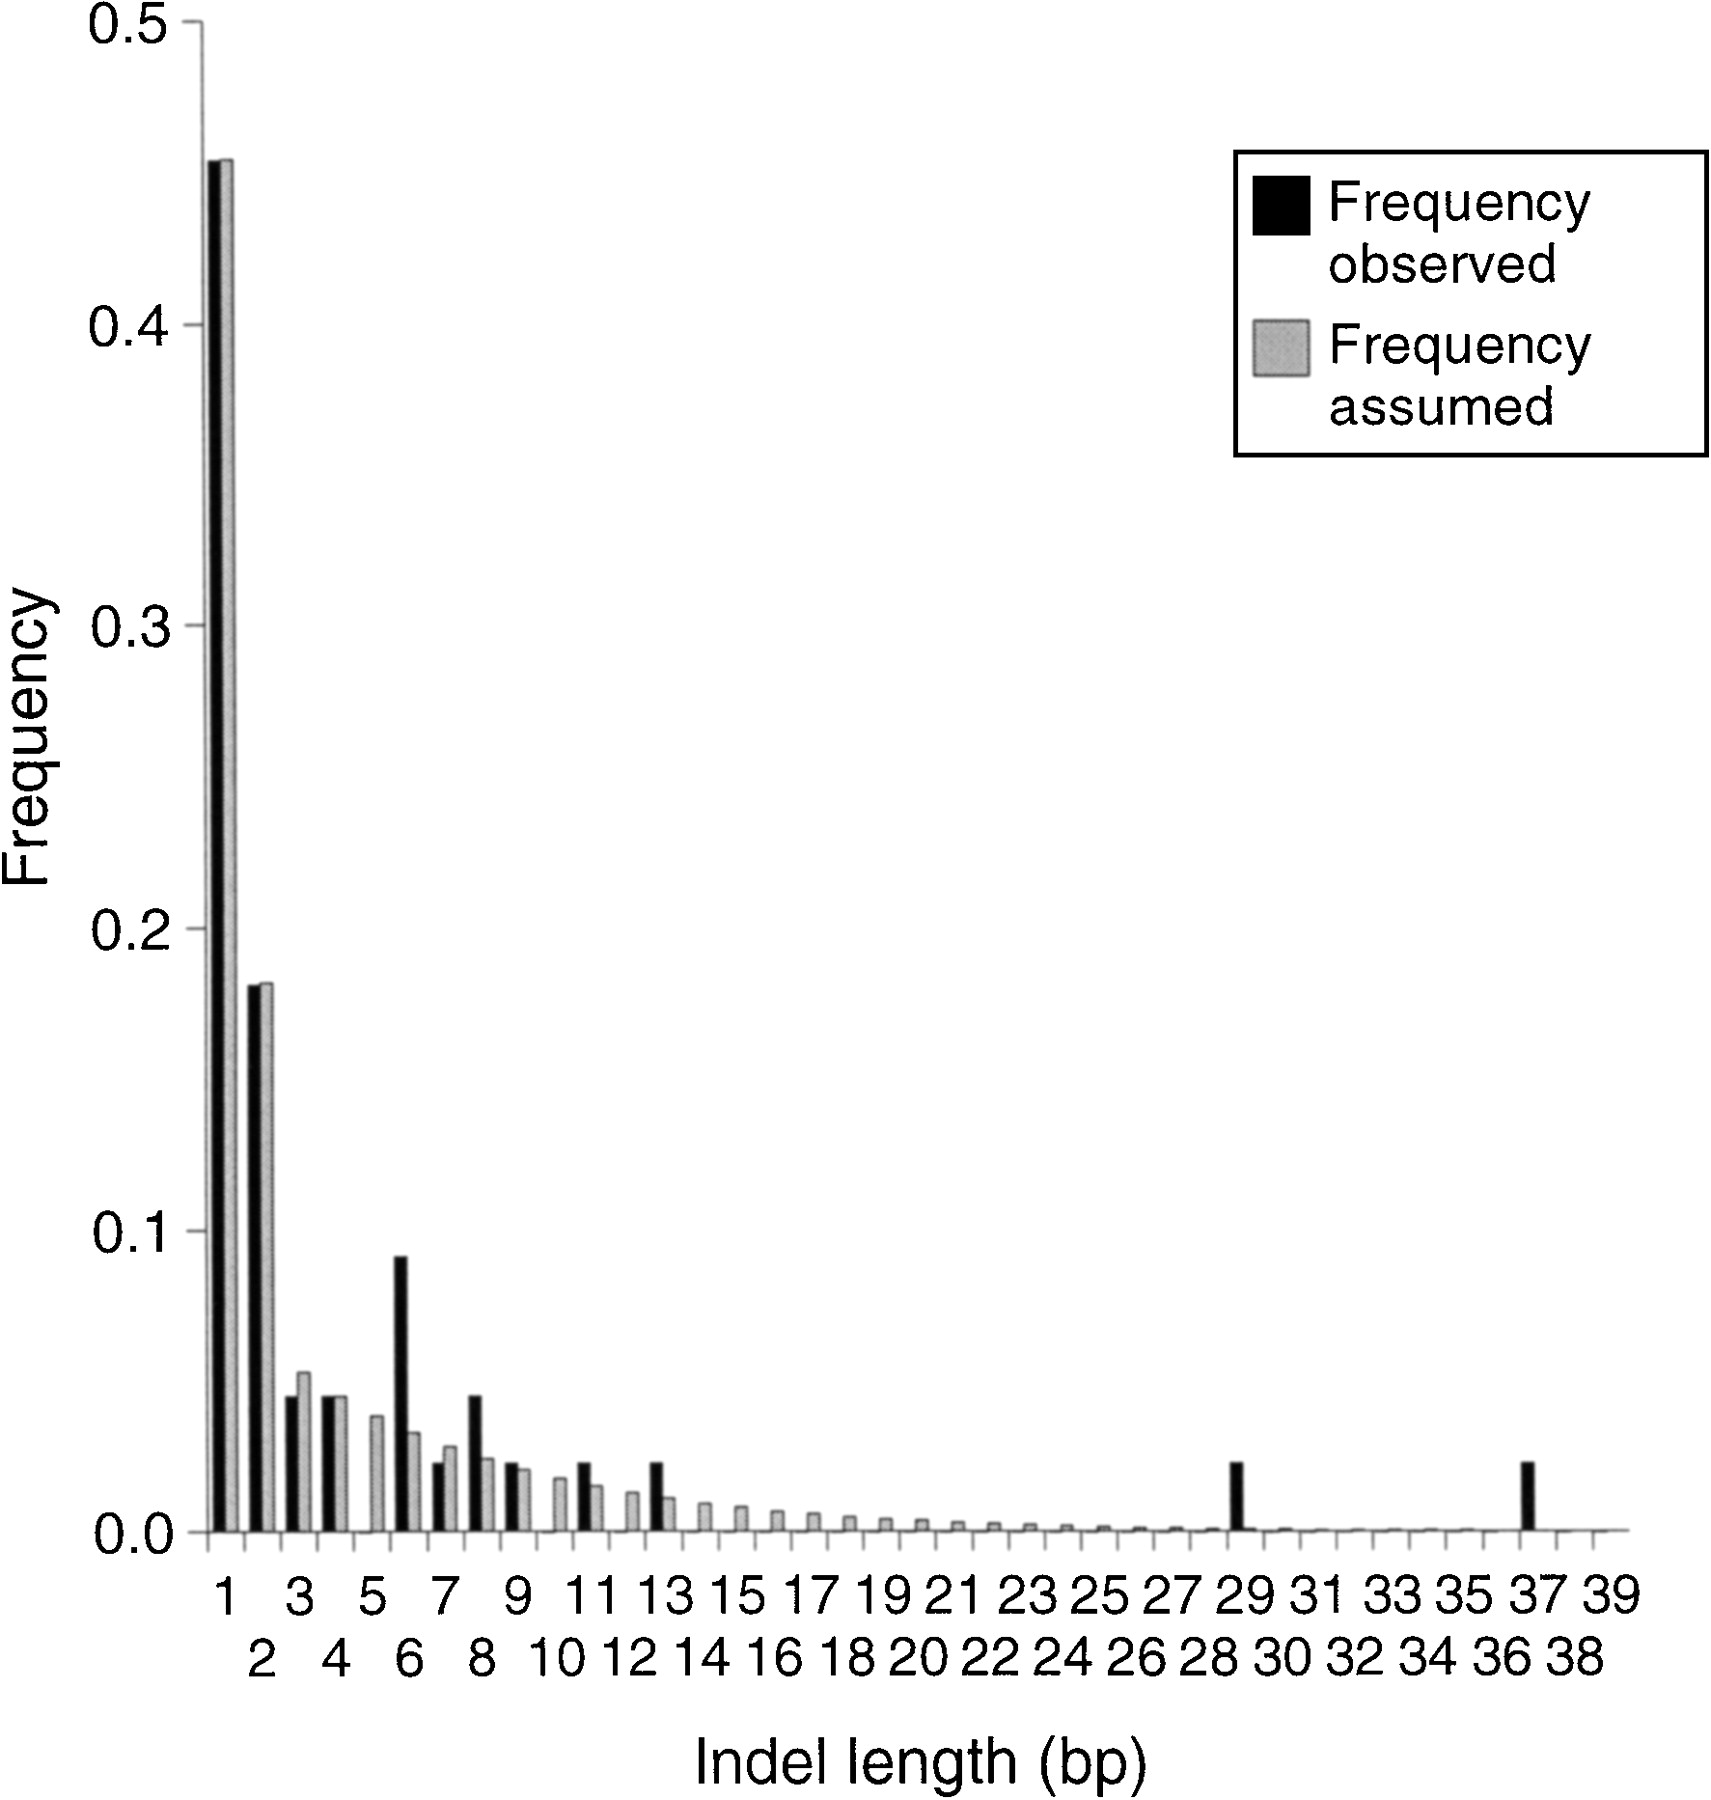
The empirical distribution of indel lengths in noncoding DNA between D. simulans and D. sechellia, and the indel length frequency distribution model assumed for the MC analysis.
(Downloading may take up to 30 seconds. If the slide opens in your browser, select File -> Save As to save it.)
Click on image to view larger version.
The empirical distribution of indel lengths in noncoding DNA between D. simulans and D. sechellia, and the indel length frequency distribution model assumed for the MC analysis.
 CiteULike
 Delicious
 Digg
Digg Facebook
 Google+
 Reddit
 Twitter
