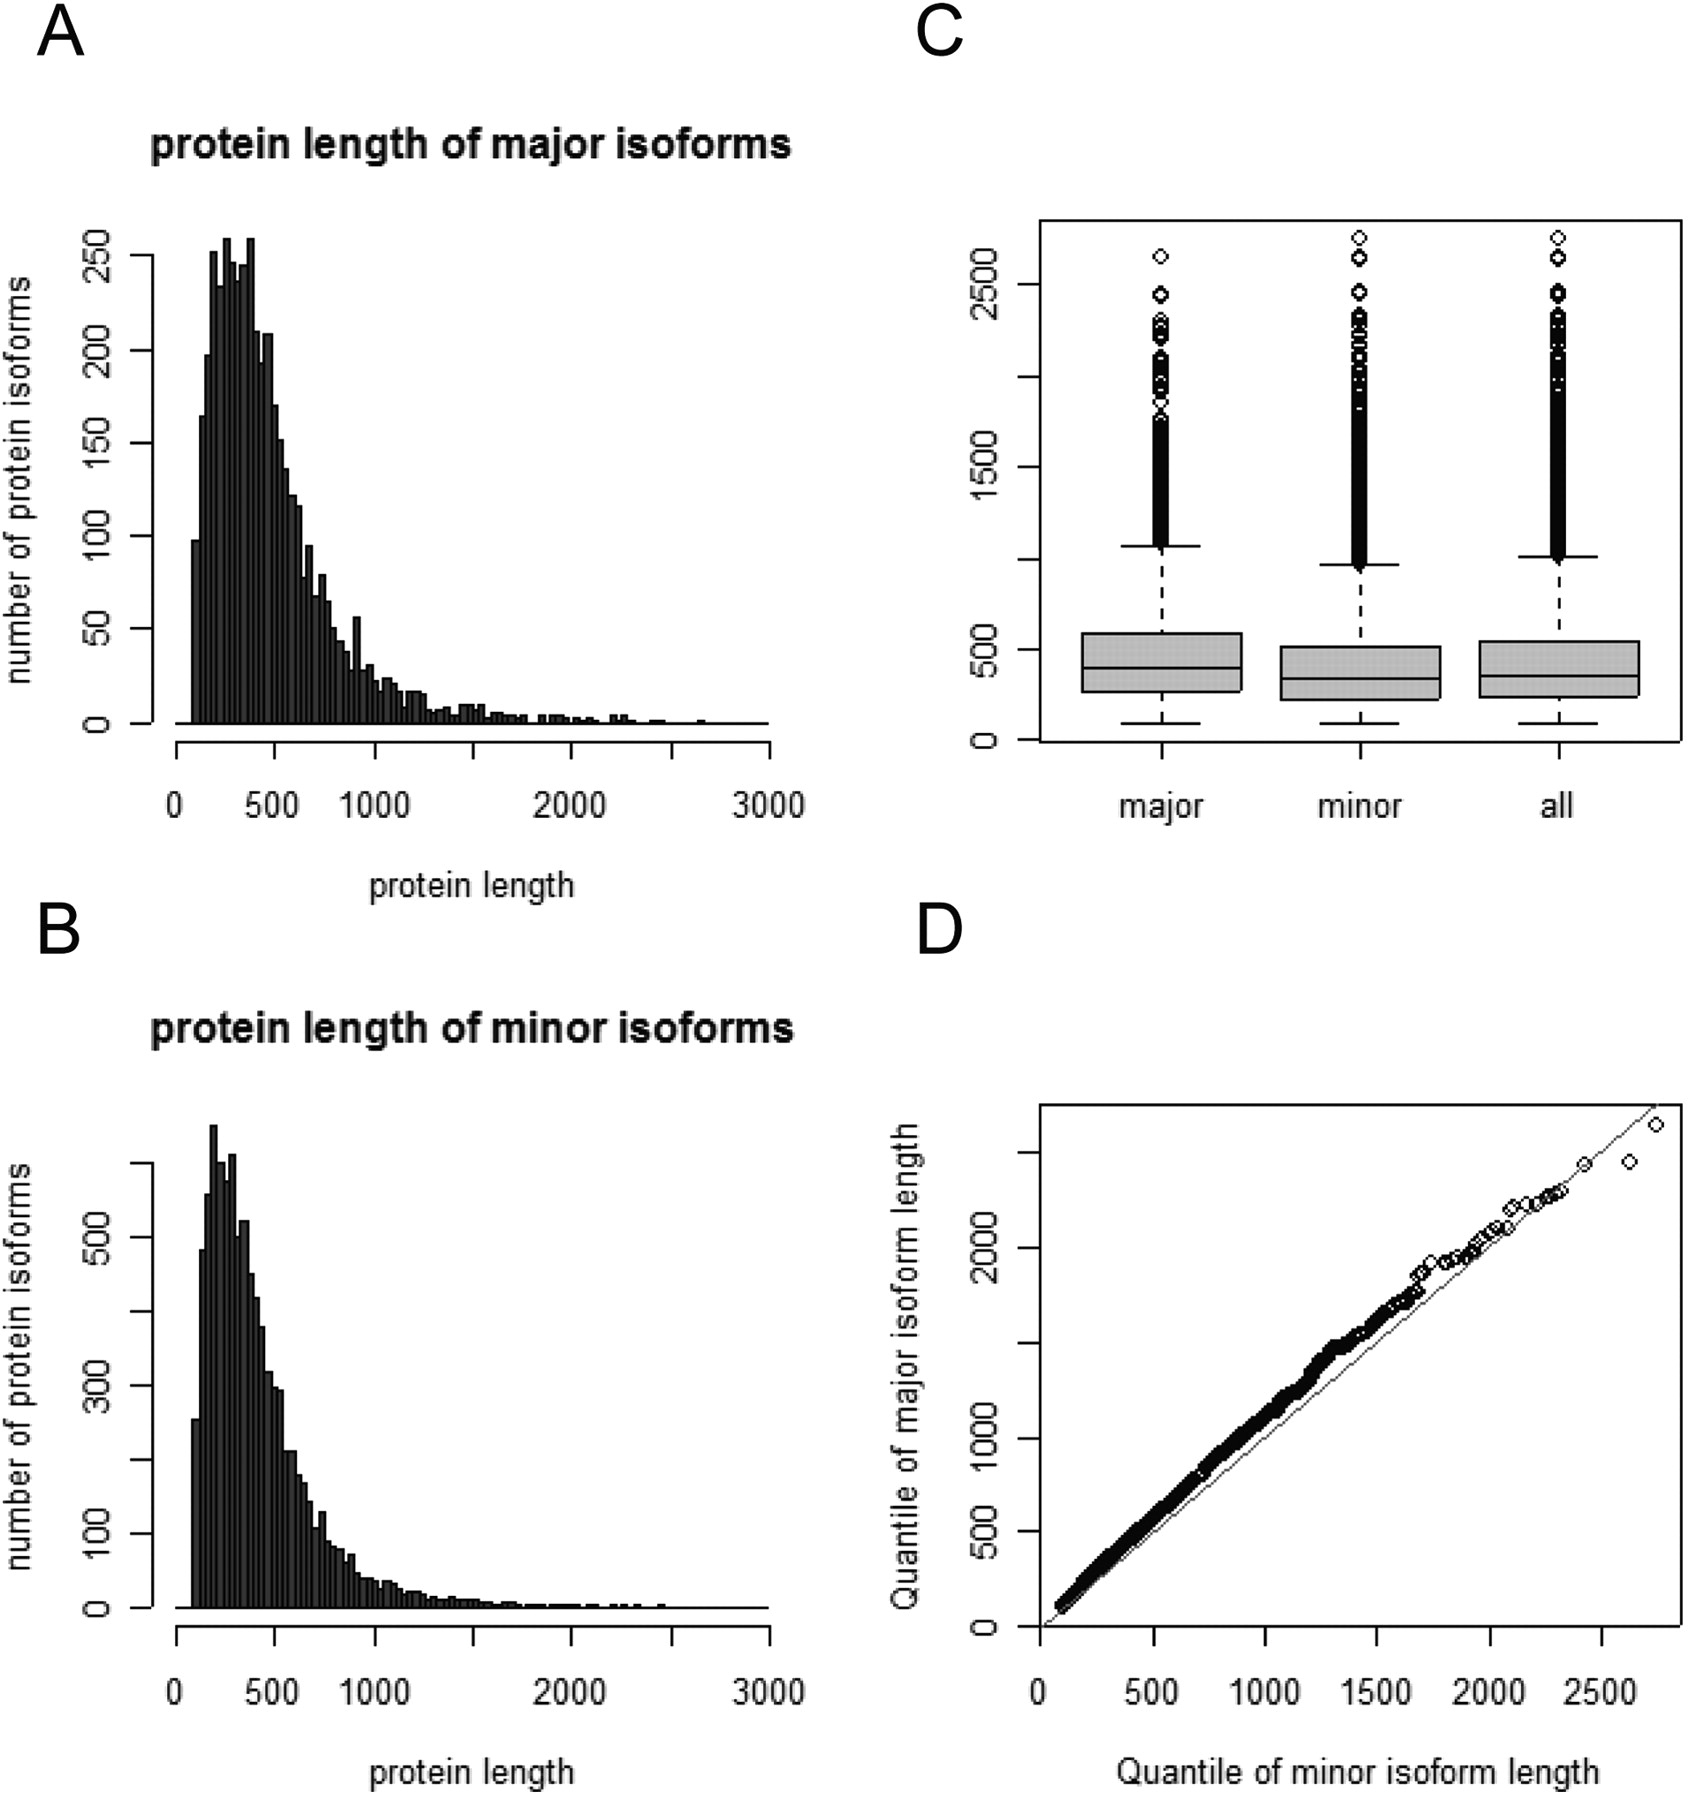
The Multiassembly Problem: Reconstructing Multiple Transcript Isoforms From EST Fragment Mixtures

(Downloading may take up to 30 seconds. If the slide opens in your browser, select File -> Save As to save it.)

Click on image to view larger version.

Figure 9
Figure 9

Comparison of protein length distributions for major versus minor isoforms. Histograms of protein length for (A) major isoforms; (B) minor isoforms. (C) Comparison of the mean and standard deviation ranges; (D) quantile–quantile plot.

This Article

  1. Genome Res. 14: 426-441

Preprint Server