
Figure 11
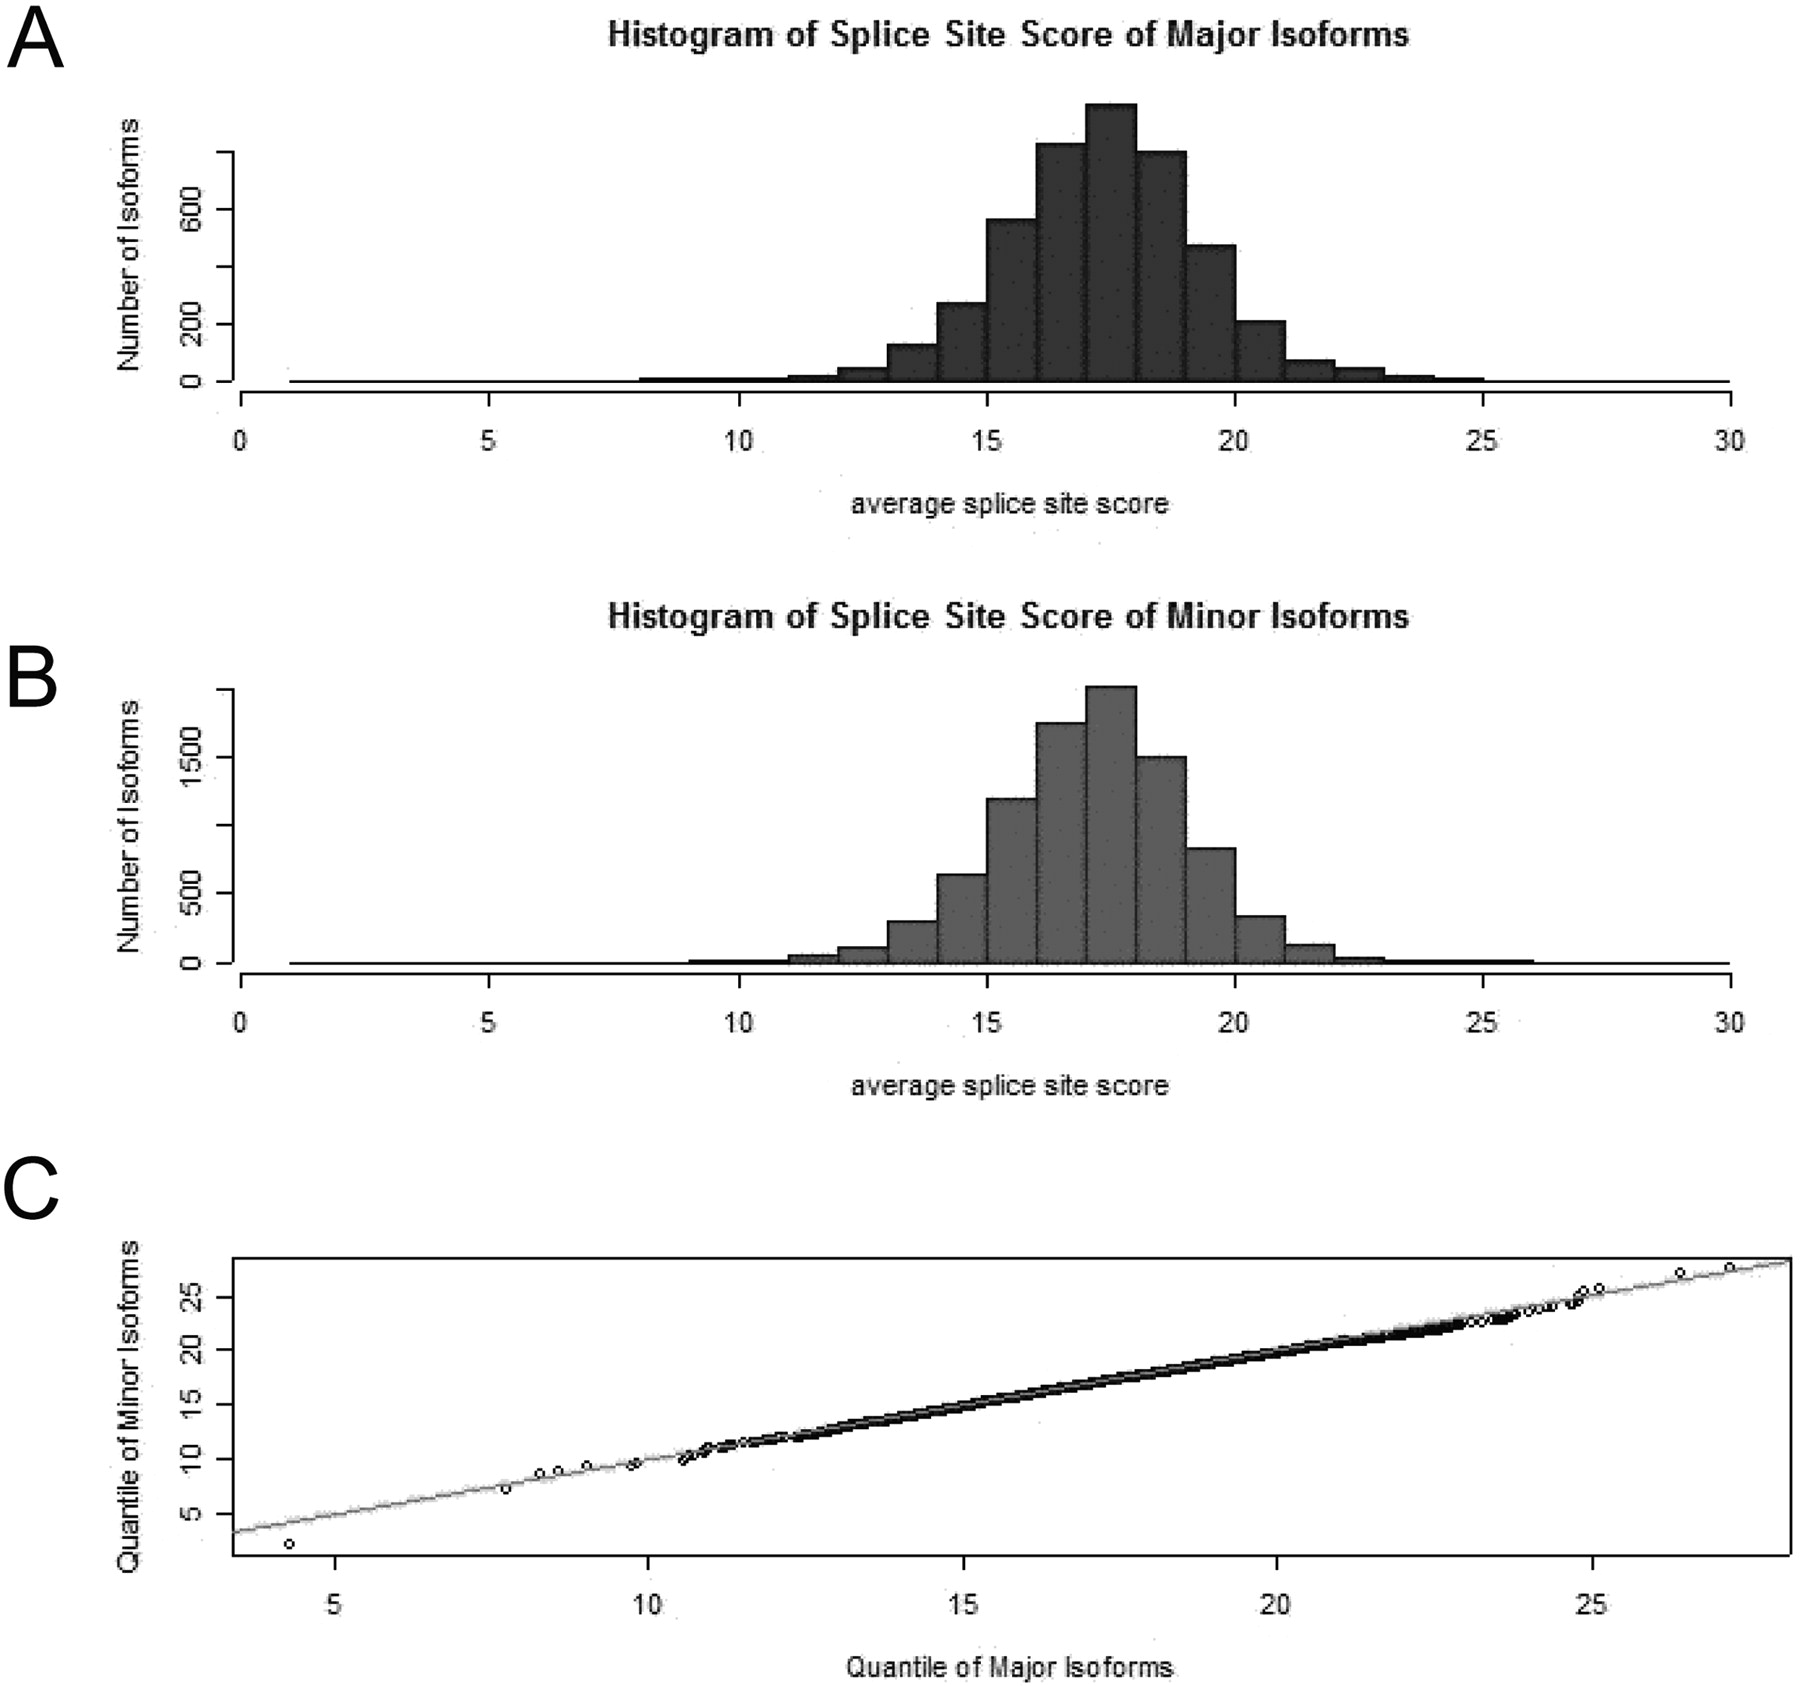
Comparison of splice site strength for major versus minor isoforms. Histograms of splice site strength for (A) major isoforms; (B) minor isoforms. (C) Quantile–quantile plot.
(Downloading may take up to 30 seconds. If the slide opens in your browser, select File -> Save As to save it.)
Click on image to view larger version.
Comparison of splice site strength for major versus minor isoforms. Histograms of splice site strength for (A) major isoforms; (B) minor isoforms. (C) Quantile–quantile plot.
 CiteULike
 Delicious
 Digg
Digg Facebook
 Google+
 Reddit
 Twitter
