
Figure 3
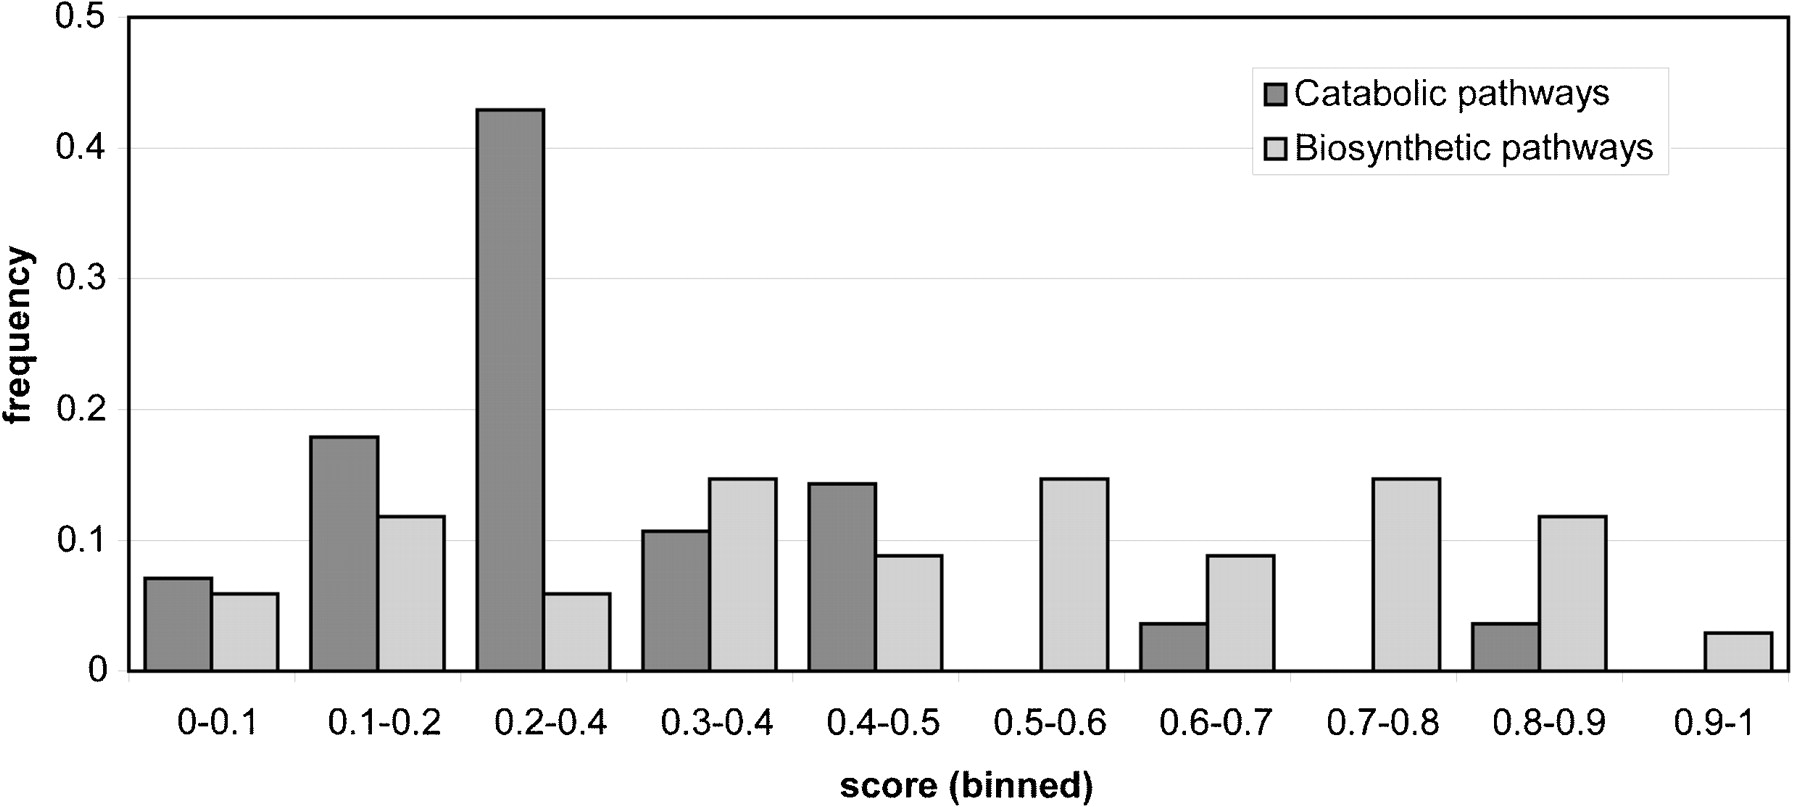
Distribution of modularity scores in catabolic versus biosynthetic pathways. Histogram of the distribution of modularity scores among catabolic versus biosynthetic metabolic pathways in EcoCyc (Karp et al. 2002).
(Downloading may take up to 30 seconds. If the slide opens in your browser, select File -> Save As to save it.)
Click on image to view larger version.
Distribution of modularity scores in catabolic versus biosynthetic pathways. Histogram of the distribution of modularity scores among catabolic versus biosynthetic metabolic pathways in EcoCyc (Karp et al. 2002).
 CiteULike
 Delicious
 Digg
Digg Facebook
 Google+
 Reddit
 Twitter
