
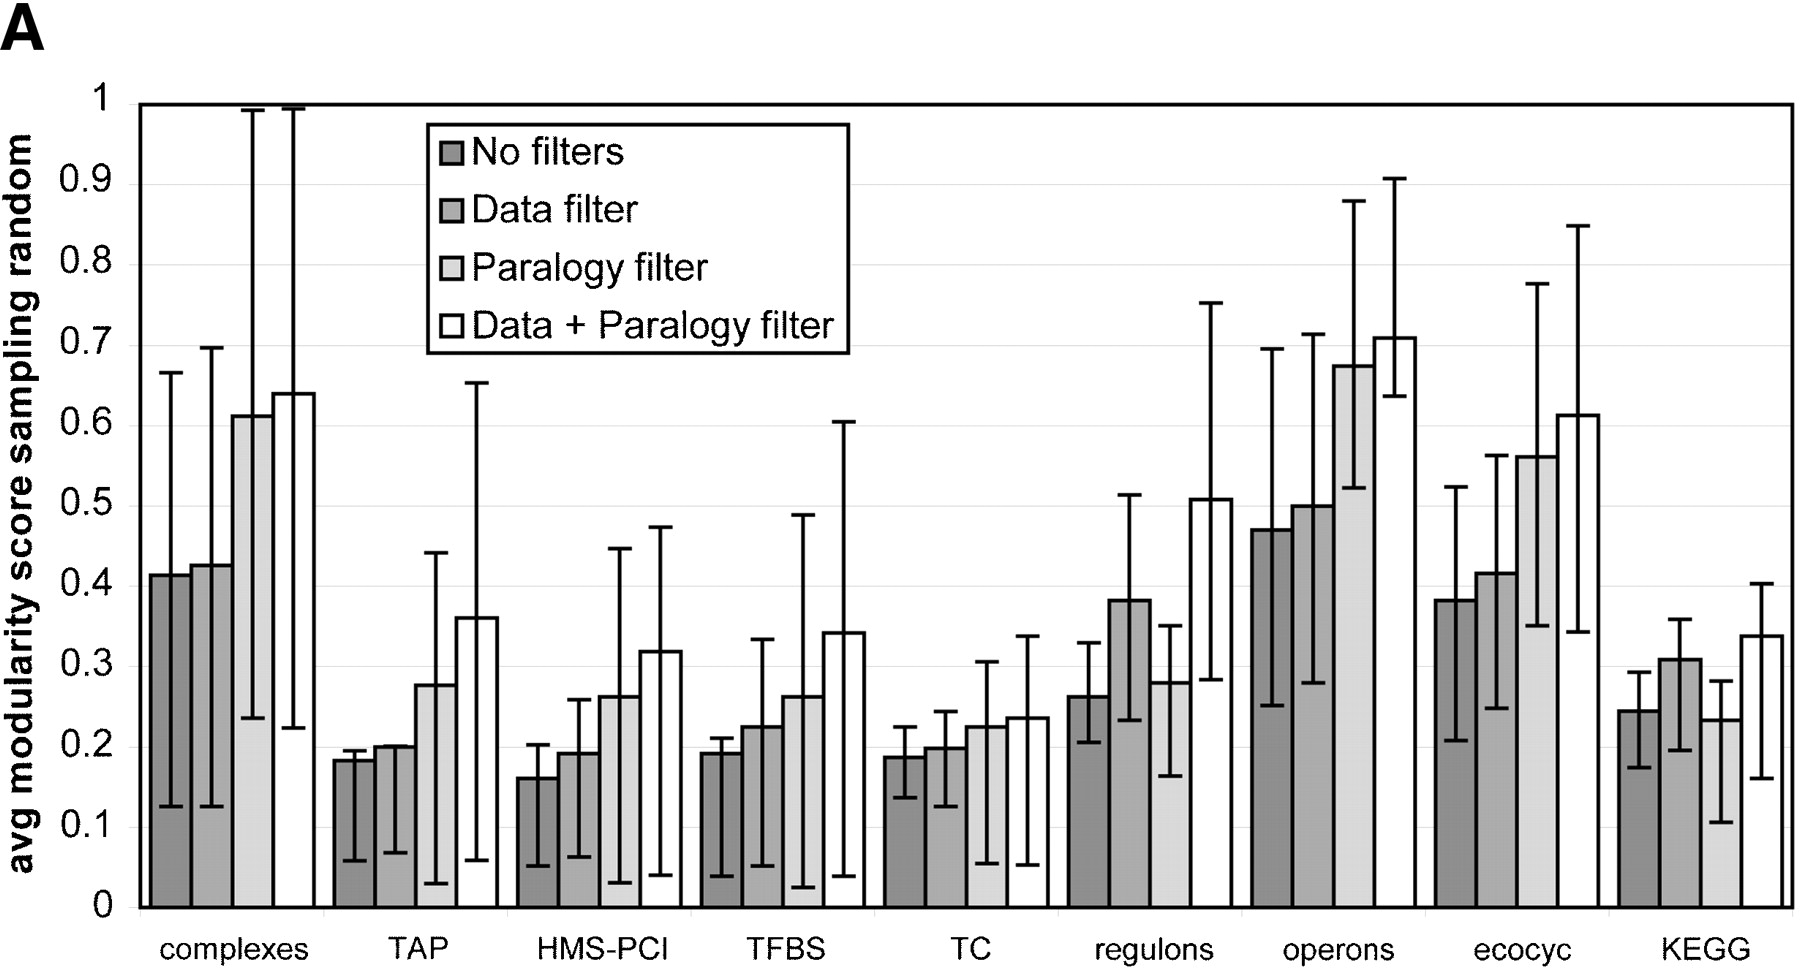
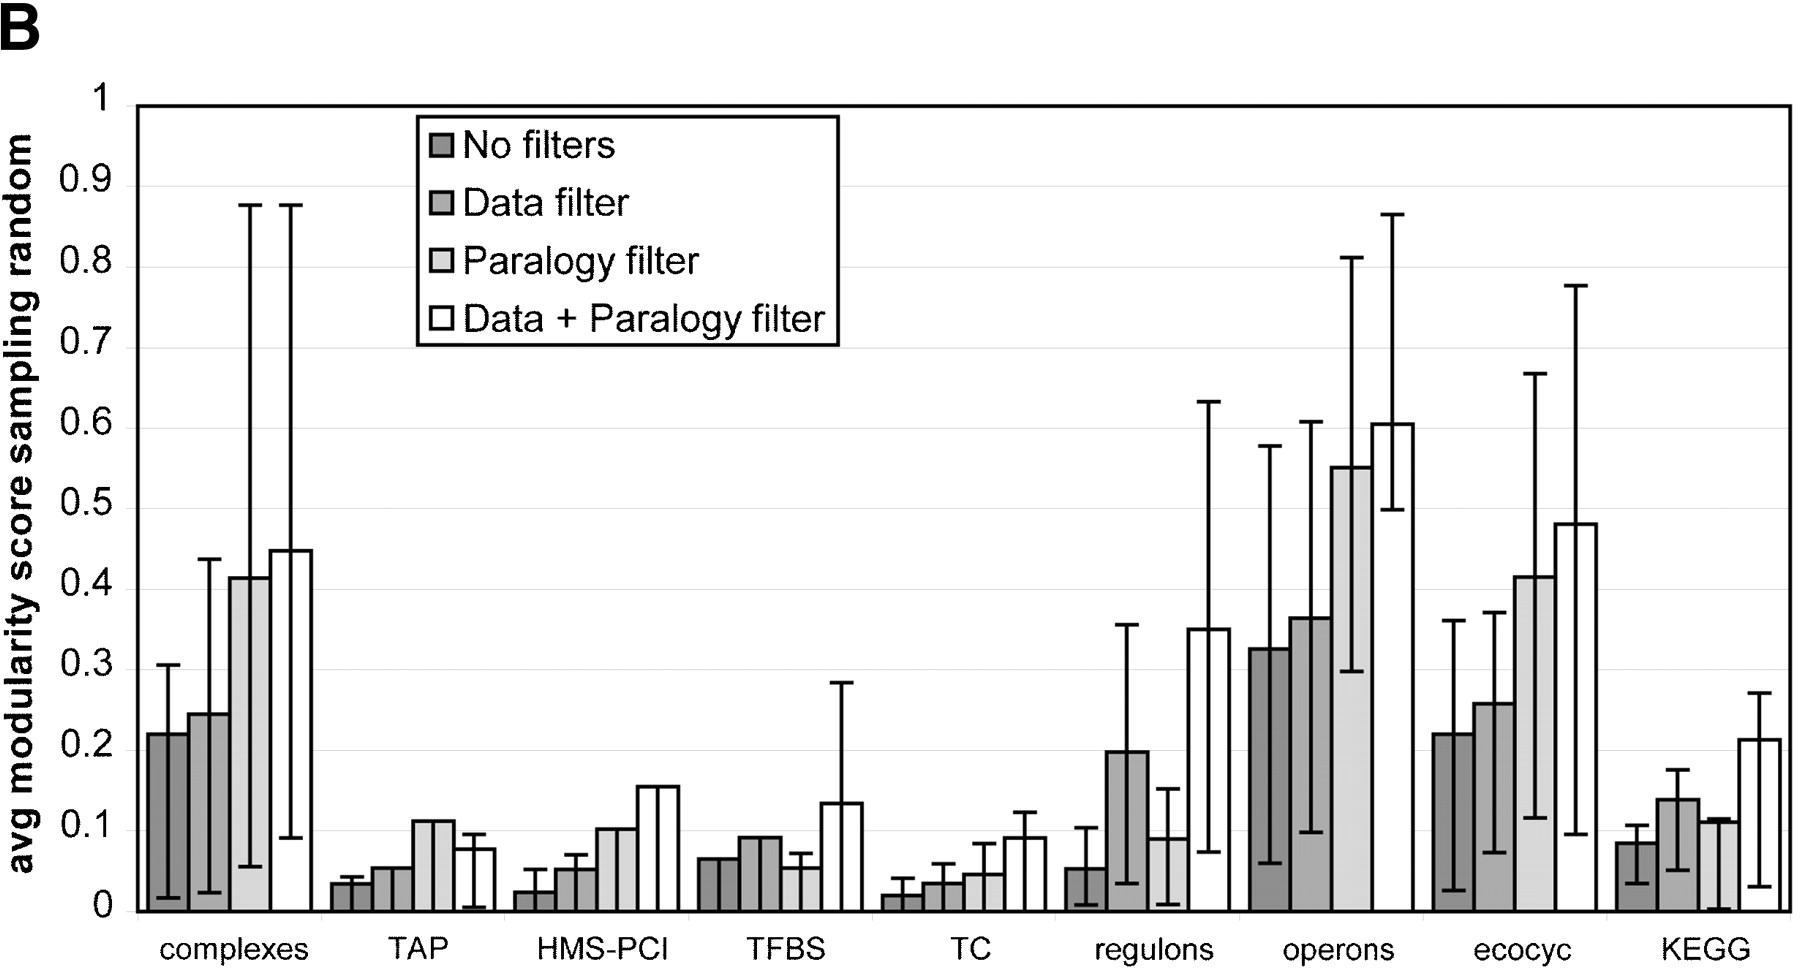
Distribution of the average scores for various filters for all data sets. The error bars reveal the spread of the modularity score within a single data set. The length of the bars represents the lower quartile and upper quartile respectively. Note that this allows for asymmetric bars. Very asymmetric bars suggest a huge gap between mean and median. (A) The average scores when the random baseline is obtained by random shuffling. This randomization ignores the phylogenetic and size patterns in the distribution of genomes, and is obtained by redistributing orthologs of the proteins in the module randomly across all species. (B) The average scores when the random baseline is obtained by random sampling. This baseline does take into account inherent signals in shared gene content such as phylogenetic distance and genome size. It achieves this by sampling other genes from the species in which the functional module is defined that have the same frequency as the genes from the functional module, thereby conserving any intrinsic signals in the presence of genes.


