
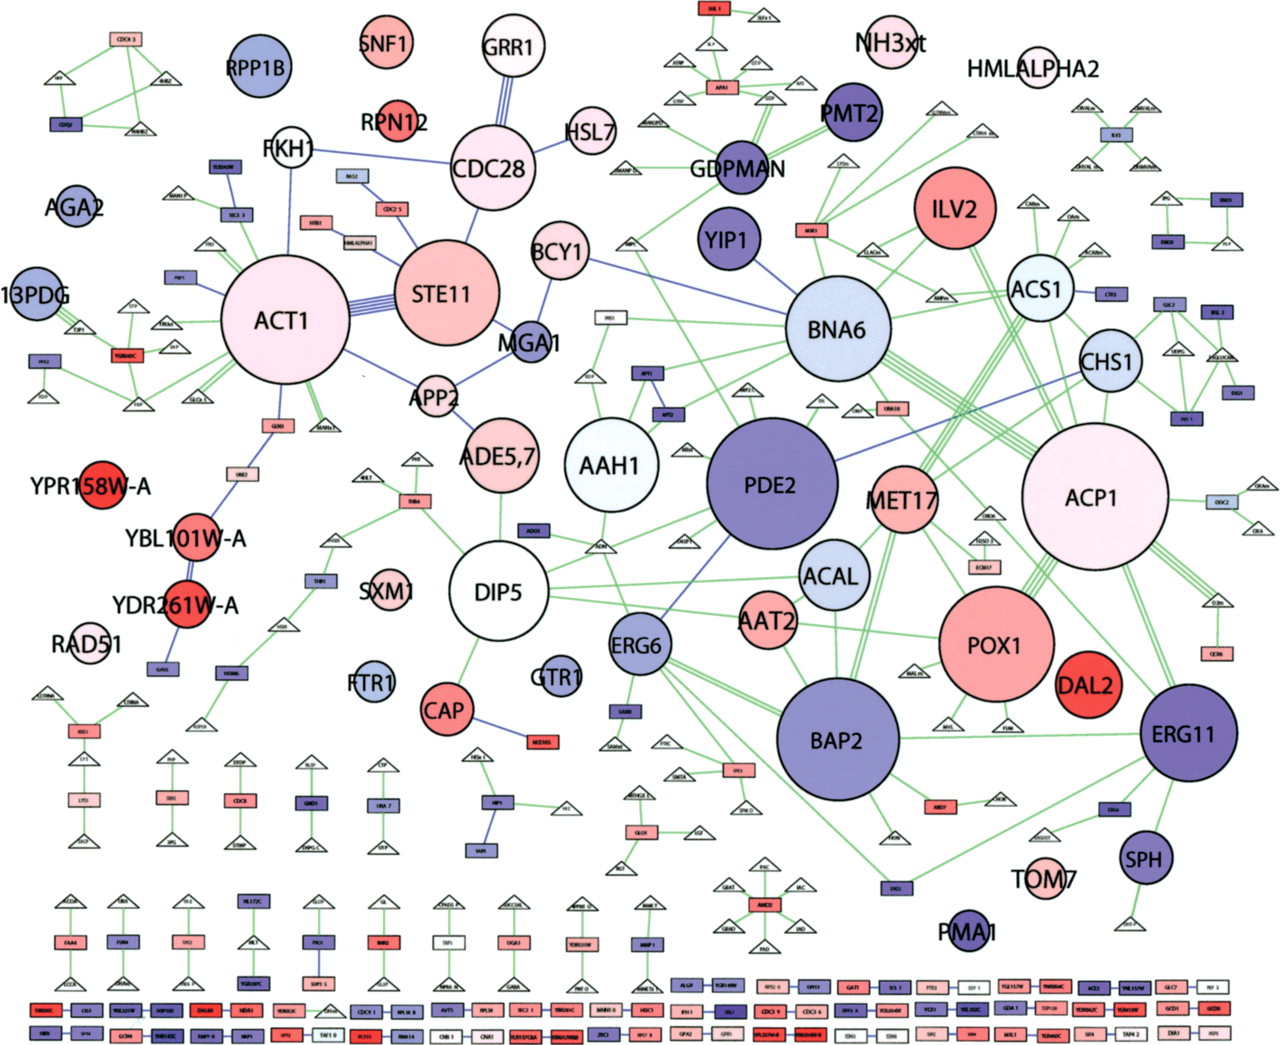
Figure 3
Modular abstraction of the filamentation network. Network clusters are abstracted as circular “module nodes.” Otherwise, colors and shapes represent the same as in Figure 2. The area of each module node is proportional to the number of member molecules. The color of each module node reflects the average expression log-ratio of member genes. Each module node is automatically assigned the name of the member node of highest intracluster degree (the highest number of interactions with cluster co-members); most are proteins, some are metabolites. See Supplemental Table 3 for a list of cluster members.


