
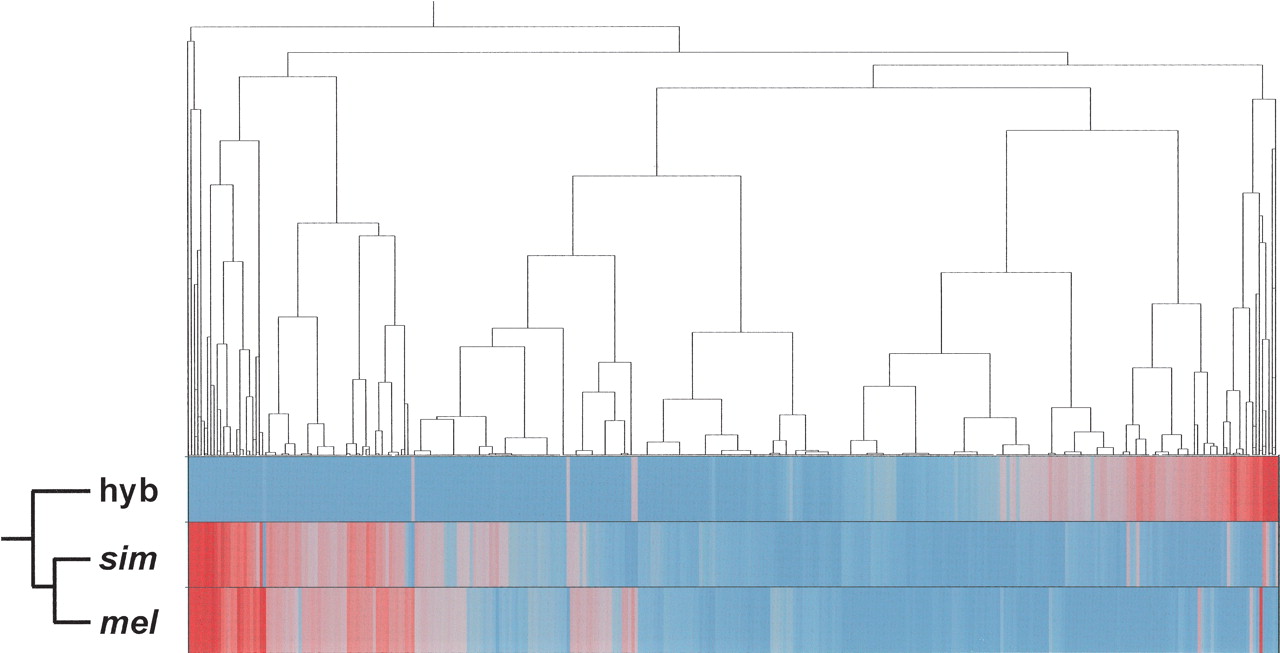
Figure 3
Hierarchical clustering of the mean levels of expressions estimated using a Bayesian methodology (BAGEL) for the whole-body experiments. Underexpressed genes (blue); overexpressed genes (red). Ward's minimum variance was used as a distance metric. The dendrogram includes 3965 genes that showed significantly different expression levels in at least one of the three pairwise comparisons between females. (mel) D. melanogaster; (sim) D. simulans; (hyb) hybrid.


